
Aayush Jindal

Recap and outlook
November fetched weakness for the greenback since pairs such as EUR/USD and GBP/USD traded higher from key support levels. On the other hand, the USD/JPY pair failed to move above a crucial resistance at 114.75-115.00 and declined below 113.00.
The US Dollar mostly struggled on the back of dovish FOMC meeting minutes which created doubts about a rate hike in December. However, a solid increase in the US GDP and hopes of rise in the CPI might help the greenback.
- Dovish FOMC meeting minutes might continue to weigh on the US Dollar and the market will be looking forward to the Dec’s interest rate decision.
- GBP/USD is building positive outlook and it will most likely continue to move higher toward 1.3600.
- USD/JPY’s decline below 112.00 was crucial and it might weigh further if the pair fails to hold 111.00.
US Dollar
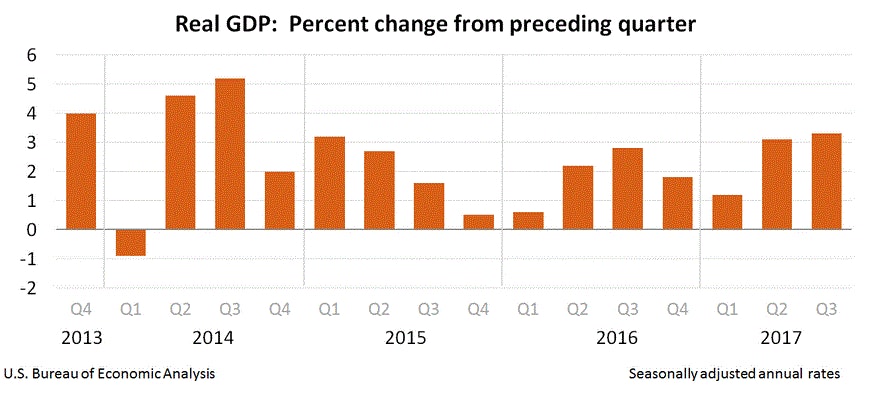
The US Dollar declined in Nov 2017 versus most major currencies, including the Euro, British Pound and the Japanese Yen. The US CPI remained near 2% and dovish fed weighed a lot on the greenback. The main economic event that helped the US dollar was the second estimate of the GDP. According to the report, the GDP grew at 3.3%, better than the forecast of 3.2% and above the last 3.0%.
Looking back at fundamentals
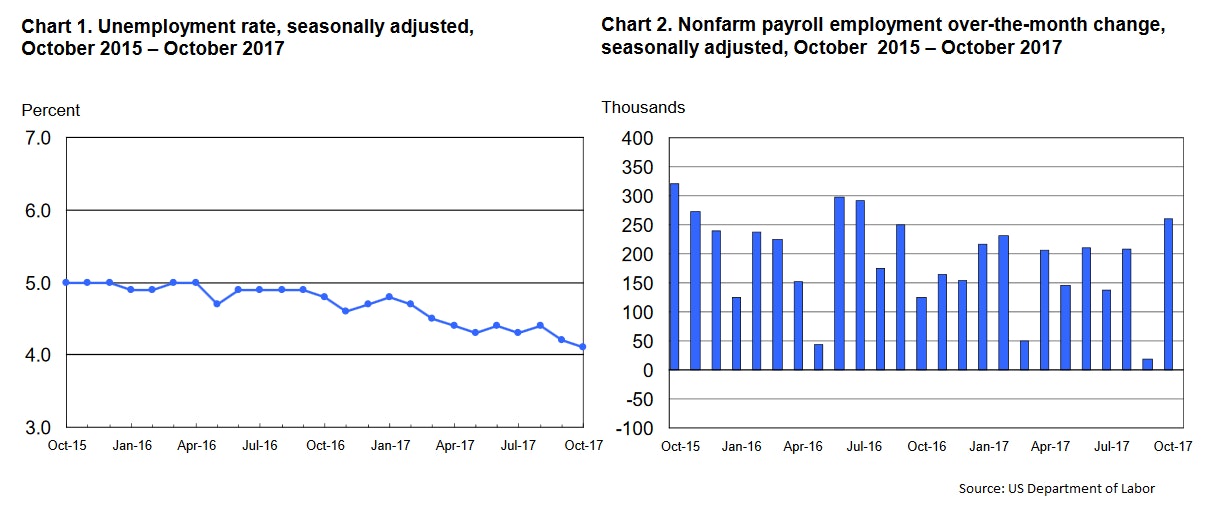
- October 2017 ADP Employment posted a change of
 235K compared with the market expectation of 200K. However, the last reading was revised down from 135K to 110K.
 - The nonfarm payroll (NFP) employment released by the US Department of Labor increased by
 261K in October 2017, less than the market expectation of 310K. On the positive side, the last reading was revised up from -33K to +18K.
 - The US unemployment rate registered a decline from 4.2% to 4.1% in October 2017.
- The US Consumer Price Index in October 2017 increased 2.0% (YoY), similar to the market forecast, but lower than the last +2.2%.
- The second estimate of the Gross Domestic Product Annualized reading for Q3 2017, released by the US Bureau of Economic Analysis posted a growth of 3.3%, which was more than the forecast of 3.2%.
December 2017 might bring a lot of volatility ahead of the Christmas Holiday. Traders will keep a close eye on events like the US NFP, CPI and the most important Fed interest rate decision. November 2017 nonfarm payrolls figure could trigger a lot of speculation and is forecasted to post an increase of more than 250K jobs. However, November’s CPI figure would be the driving force since the market is looking for an increase of more than 2.1%.
Finally, the Fed interest rate decision since investors and experts believe that the central bank may opt to increase rates from 1.25% to 1.50%. If the central bank raise rates, there can be heavy swing moves in pairs such as EUR/USD, USD/JPY and GBP/USD.
Gold price forming uptrend?
Gold price after declining below $1300 against the US Dollar found support near $1260. The price is now in a recovery mode and already moved above the 23.6% Fib retracement level of the last major drop from the $1357 high to $1260 low.
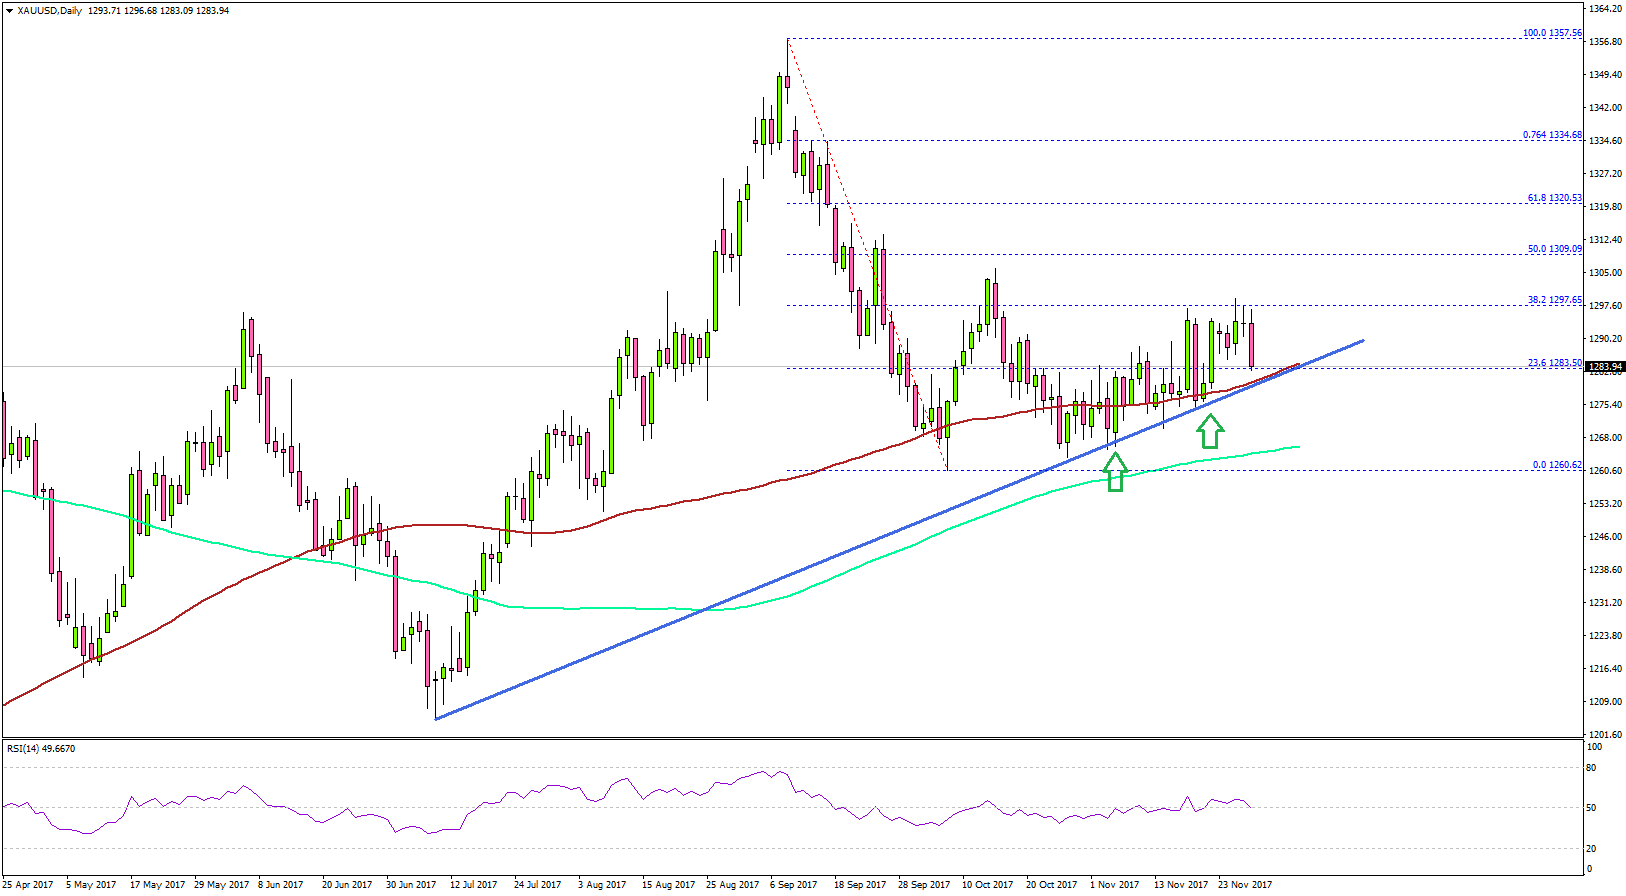
It seems like there is a major bullish trend line forming with support near $1275-1280 on the daily chart of XAU/USD. The price is now well above $1275, 100-day simple moving average (red) and the 200-day simple moving average (green), which is a positive sign.
Japanese Yen
The Japanese Yen gained traction against the US Dollar in November 2017 as the USD/JPY pair declined below 112.00. However, the USD/JPY pair is currently holding the 111.00 support, which is encouraging.
Looking back at fundamentals
- The first preliminary estimate for Japan’s GDP in Q3 2017 posted an increase of 1.4%, more than the market expectation of +1.3%.
- The Nikkei Manufacturing PMI in Oct 2017 posted a rise to 52.8 from 52.5.
- Japan’s Total Merchandise Trade Balance in Oct 2017, released by the Ministry of Finance registered a trade surplus of ¥285.4Bz, less than the market forecast of ¥330.0B.
- Japan’s All Industry Activity Index in Sep 2017 declined by 0.5%, more than the market forecast of -0.4%.
The increase in Japan’s GDP is bullish, but other driving factors might stop further upsides in the Japanese Yen against the US Dollar.
USD/JPY to bounce back?
In November 2017 monthly report, we discussed a major bearish pattern (triple top) for the USD/JPY pair. The pair struggled to invalidate the pattern and found strong offers above 114.20-114.40.
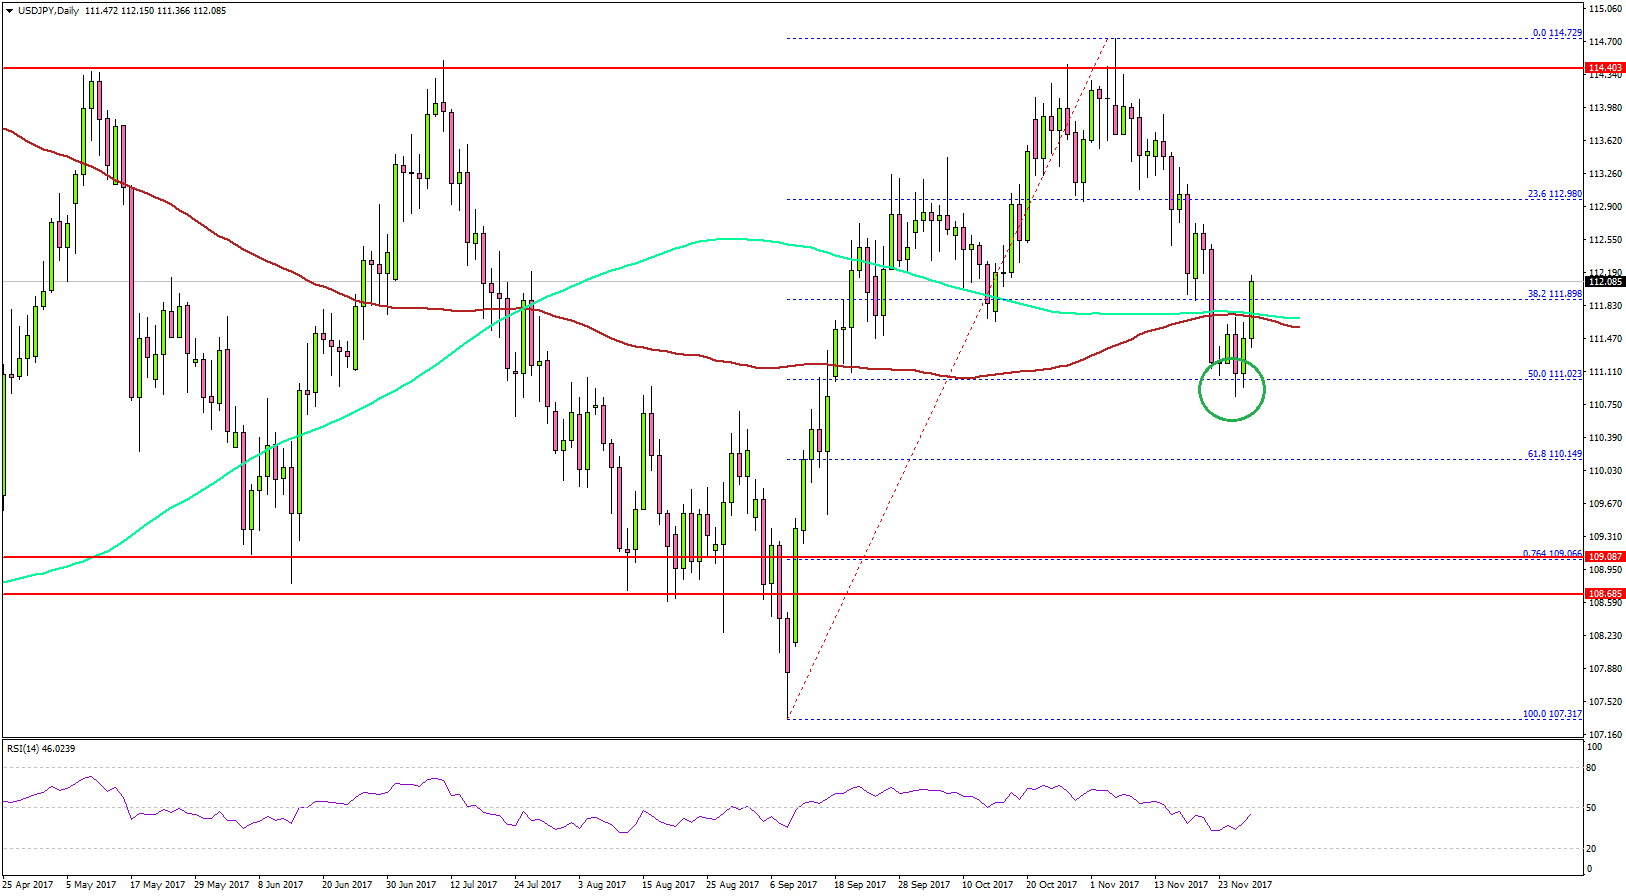
USD/JPY started a downside move and traded below the 38.2% Fib retracement level of the last wave from the 107.31 low to 114.72 high. More importantly, the pair broke the 112.00 support, 100-day simple moving average (red) and the 200-day simple moving average (green).
However, the 50% Fib retracement level of the last wave from the 107.31 low to 114.72 high at 111.02 is acting as a decent support. The pair is now attempting a recovery and back above both SMA’s (100 and 200).
Therefore, as long as the pair is above 111.00, there are chances of it moving higher towards 113.00. On the flip side, a close below 111.00 would call for a test of the 109.20-109.00 support.
EUR/JPY and GBP/JPY: Both other major Japanese Yen pairs remain in the bullish zone. The EUR/JPY pair is consolidating above the 131.00 support and is eyeing further gains. The GBP/JPY pair is also placed nicely above the 147.00 support area.
Important supports for EUR/JPY are 131.45 and 130.00, and resistances are at 134.00 and 135.00. GBP/JPY has a major support area near 147.00-147.20, and on the upside it is facing hurdles near 150.80 and 152.00.
Euro
It was mostly a good week for the Euro especially against the US Dollar. However, it was mainly due to the US Dollar weakness. On the Economic front, German coalition talks failed and now there are high chances of a new election. It could result in a higher level of uncertainty and weakness for the shared currency in the near term.
Looking back at fundamentals
- Euro Zone’s Manufacturing Purchasing Managers Index (PMI) in Oct 2017 declined to 58.5 from 58.6.
- Euro Zone’s Services PMI in Oct 2017 increased to 55.0 from 54.9.
- ECB maintained the interest rates at -0.4% with dovish stance.
- Germany’s consumer price index increased 1.6% (YoY) in Oct 2017, just as the market expected.
- Euro Area’s consumer price index increased 1.4% (YoY) in Oct 2017, just as the market expected but it’s on a declining streak, which does not match ECB’s expectation.
- Euro Area’s Industrial Production (seasonally adjusted) in Sep 2017 declined 0.6% (MoM), compared with the last increase of 1.4%.
- Germany’s ZEW Economic Sentiment in Nov 2017 came in at 18.7, less than the market forecast of 20.0 but more than the last 17.6.
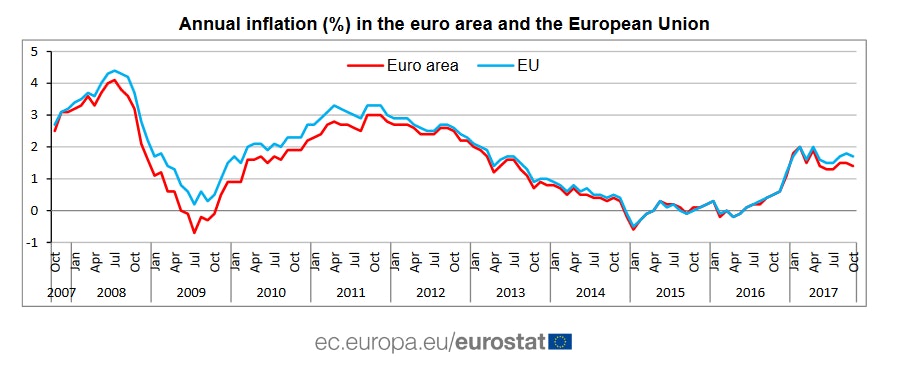
The CPI in the Euro area is one of the main concerns at the moment. It needs to move higher towards 2% and towards the ECB’s expectation. November’s reading is expected to increase 1.6%, more than the last 1.4%. Moreover, Germany’s CPI is forecasted to inch higher towards 1.7% in Nov 2017 and the unemployment change in Nov 2017 is aligned for -10K, similar to the last -11K.
EUR/USD breaks significant resistance
The Euro after a bearish run found support near the 1.1600 area against the US Dollar. The EUR/USD pair started an upside move and traded above the 38.2% Fib retracement level of the last decline from the 1.2092 high to 1.1554 low.
More importantly, the pair broke the 1.1750 resistance and settled above the 100-day simple moving average (red). It recently tested the 76.4% Fib retracement level of the last decline from the 1.2092 high to 1.1554 low at 1.1965.
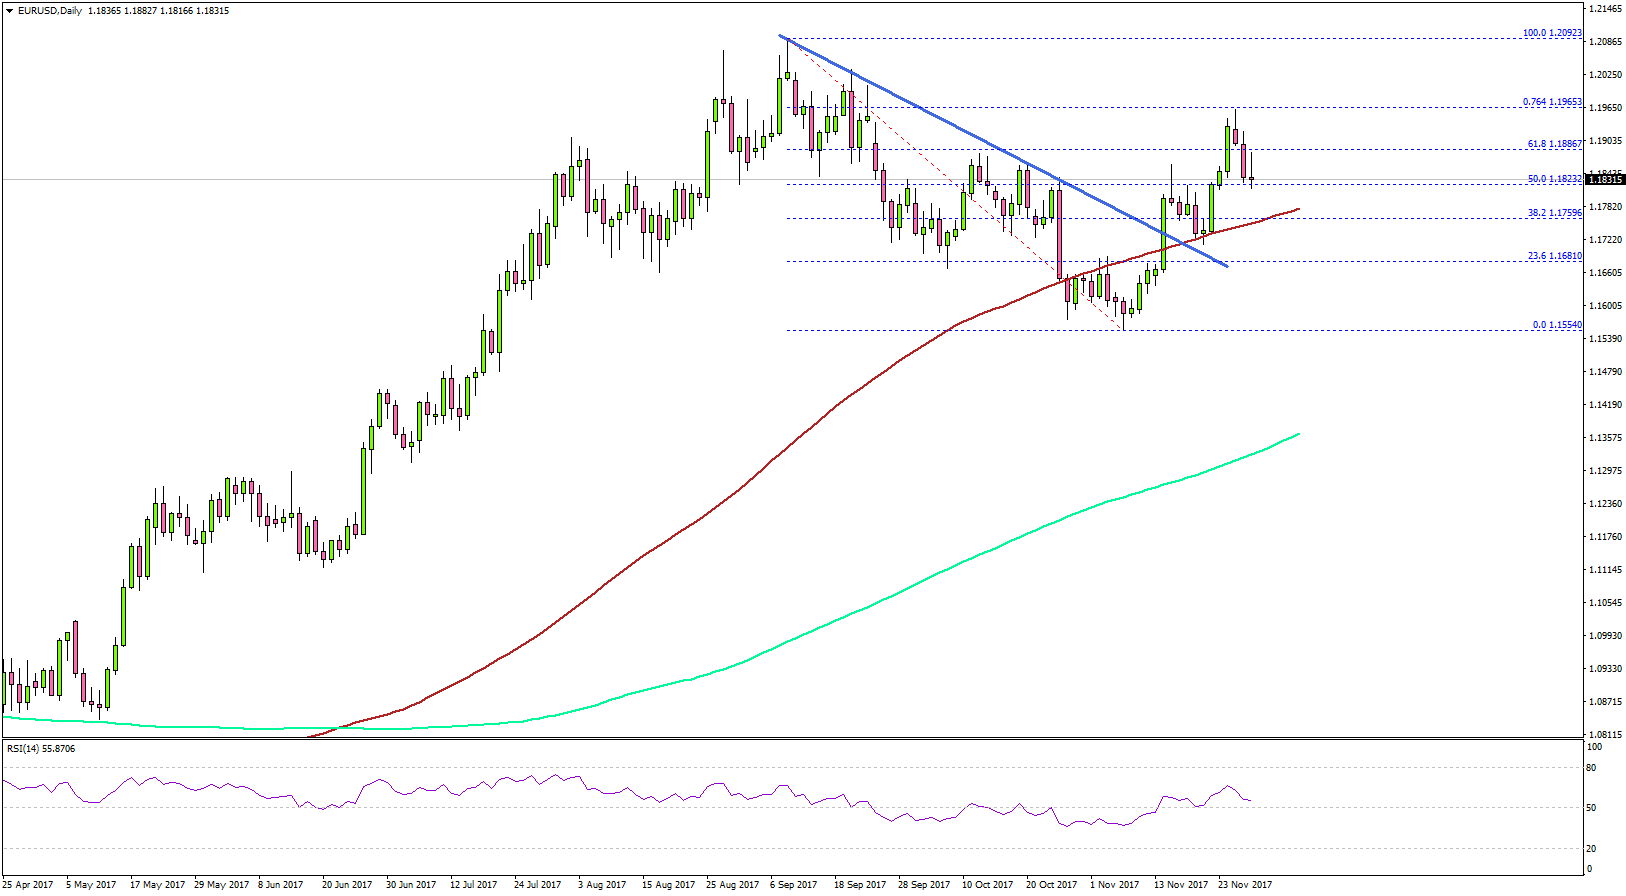
A minor correction is underway from 1.1960, but the downside move will most likely find support near 1.1750. The mentioned 1.1750 was a major resistance earlier and now it could act as a strong support since it is also aligned with the 100-day simple moving average (red).
On the upside, the 1.1960 and 1.2000 levels are important resistances. A break above 1.2000 would be significant for a larger uptrend for EUR/USD.
British Pound
The Bank of England decision to raise interest rates from 0.25% to 0.50% was digested well by investors. There was a decent recovery initiated in the British Pound and the GBP/USD pair survived a crucial breakdown below the 1.5000 handle.
Looking back at fundamentals
- The Bank of England raised interest rates from 0.25% to 0.50%.
- UK’s Consumer Price Index in Oct 2017 (YoY), released by the National Statistics increased to 3%, less than the forecast of 3.1% but similar to the last 3.0%.
- UK’s Claimant Count in Oct 2017 registered a neutral result with a change of 1.1K, slightly lower than the forecast of 2.3K.
- The UK Retail Sales in Oct 2017 declined by 0.3% (YoY), compared with the last revised increase of 1.3%.
- According to the second estimate, the Gross Domestic Product in the UK for Q3 2017 grew +1.5%, similar to the last +1.5%.
- The Bank of England
The Claimant Count Change for Nov 2017 would be the main focus in December 2017. Moreover, if the CPI continues to stay above the 2.6% mark, then the GBP/USD pair will most likely remain in the bullish zone.
GBP/USD is in crucial uptrend
In November 2017 monthly report, we saw how the British Pound was approaching a major support area near 1.3000-1.3050. The GBP/USD pair tested the mentioned 1.3000-1.3050 support zone and found strong bids.
Sellers failed to gain momentum below 1.3000 and a consolidation phase was initiated. After completing consolidating, the pair made a nice upside move and traded above the 38.2% Fib retracement level of the last decline from the 1.3657 high to 1.3027 low.
On the downside, there is an important bullish trend line forming with support at 1.3170 on the daily chart, which is aligned with the 100-day simple moving average (red).
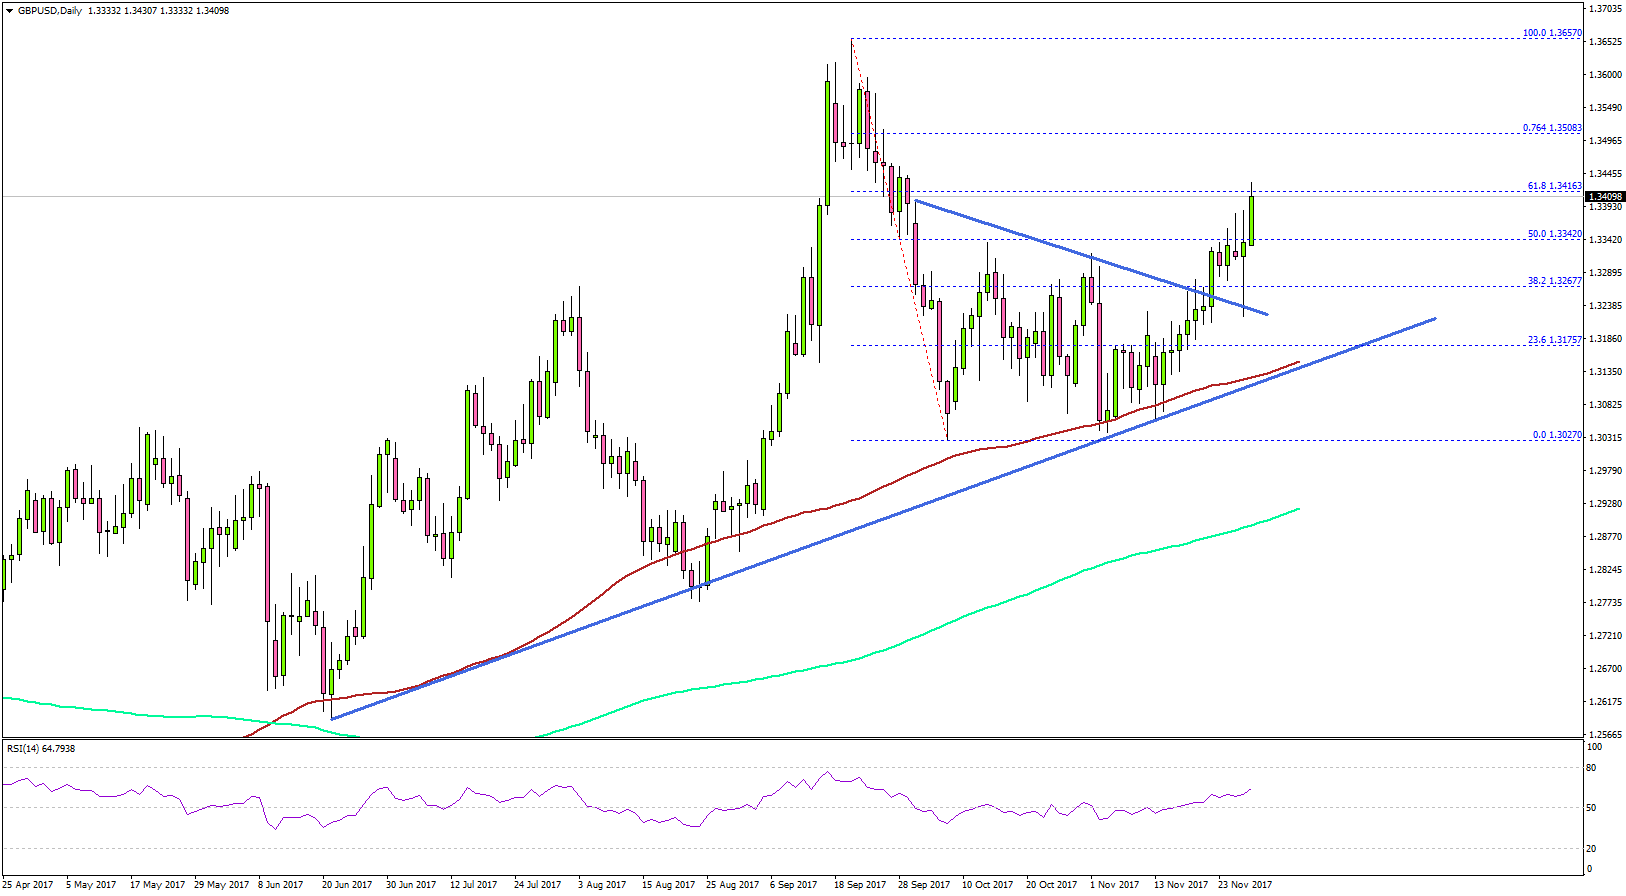
Therefore, 1.3170-1.3150 is a major support area and it might continue to prevent declines. On the upside, the pair is facing resistances near 1.3500 and 1.3650.
Summary