
Aayush Jindal
Key Highlights
- The Aussie Dollar declined recently below the0.7070 and 0.7040 supports against the US Dollar.
- A key bearish trend line is formed withresistance near 0.7030 on the 4-hours chart of AUD/USD.
- China’s Trade Balance posted a surplus of$13.84B, well below the $35.00B forecast.
- The US PPI in April 2019 could rise 0.2% (MoM),less than the last +0.6%.
AUDUSD Technical Analysis
After a close below the 0.7100 support, the Aussie Dollar extended losses below 0.7050 against the US Dollar. The AUD/USD pair corrected higher from 0.6967, but upsides remain capped below 0.7050.
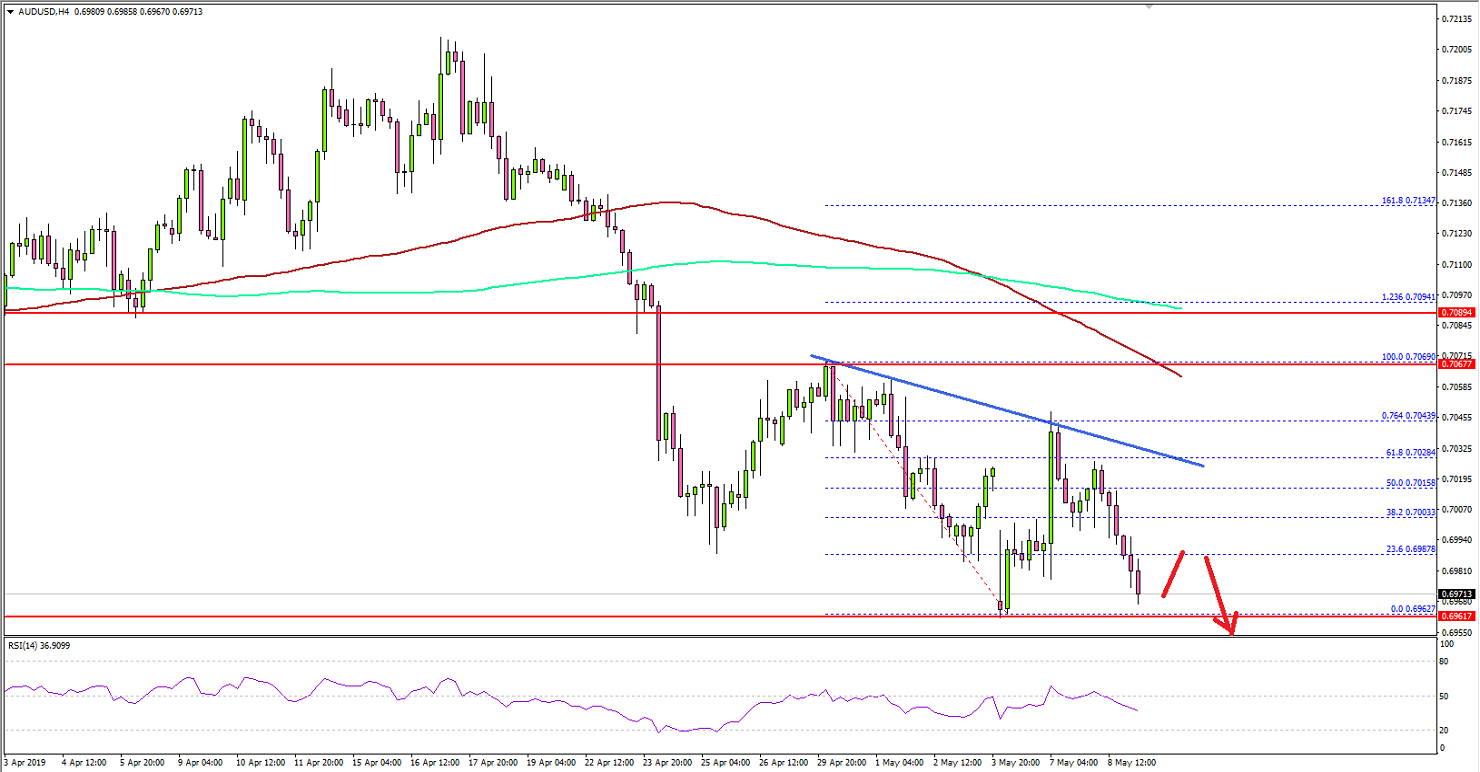
Looking at the 4-hours chart, the pair even traded below the0.7000 support area in the recent decline. The price traded close to the 0.6960level and settled well below the 100 simple moving average (red, 4-hours).
A swing low was formed at 0.6967 and recently the pairrecovered above the 0.7000 level, and the 50% Fib retracement level of the lastdecline from the 0.7069 high to 0.6962 low.
However, AUD/USD struggled to surpass the 0.7050 resistanceand failed near the 76.4% Fib retracement level of the last decline from the0.7069 high to 0.6962 low. There is also a key bearish trend line formed withresistance near 0.7030 on the same chart.
Therefore, the pair could continue to struggle unless itrebounds above the 0.7030 and 0.7050 resistance levels. Still, there are manyhurdles, waiting near 0.7070, the 100 SMA, 0.7090, and the 200 SMA (green).
Only a successful close above the 0.7100 level and the 200SMA is likely to start a decent uptrend in the coming days. If not, there is arisk of more losses below 0.7000 and 0.6960 in the near term.
Fundamentally, China’s Trade Balance report was released bythe General Administration of Customs of the People’s Republic of China. Themarket was looking for a trade surplus of around $35.00B in April 2019, up fromthe last $32.64B.
However, the actual result was well below the marketforecast, as the trade surplus was only $13.84B. The last reading was revisedfrom $32.64B to $32.67B. Exports of goods and services in April 2019 (YoY) weredown 2.7%, whereas the market was looking for a 2.3% rise.
Clearly, there was a contraction, resulting in a minor downside reaction in EUR/USD, GBP/USD and AUD/USD. Overall, the US Dollar bulls still remain in control and both Euro and British Pound are facing many hurdles.
Economic Releases to Watch Today
- US Producer Price Index April 2019 (MoM) –Forecast +0.2%, versus +0.6% previous.
- US Producer Price Index April 2019 (YoY) –Forecast +2.3%, versus +2.2% previous.
- US Initial Jobless Claims - Forecast 220K,versus 230K previous.