Can GBP/USD Bounce Back In Near Term?

Key Highlights
- The British Pound declined steadily recentlybelow the 1.3080 support against the US Dollar.
- GBP/USD traded below a major bullish trend linewith support at 1.3070 on the daily chart.
- The US Existing Home Sales in March 2019 declined4.9% (MoM), more than the -2.3% forecast.
- The US Housing Price Index in Feb 2019 could rise0.3% (MoM), less than the last +0.6%.
GBPUSD Technical Analysis
After the British Pound topped near the 1.3380 level, it declined steadily against the US Dollar. The GBP/USD pair broke the 1.3200 and 1.3080 support levels to move into a bearish zone.
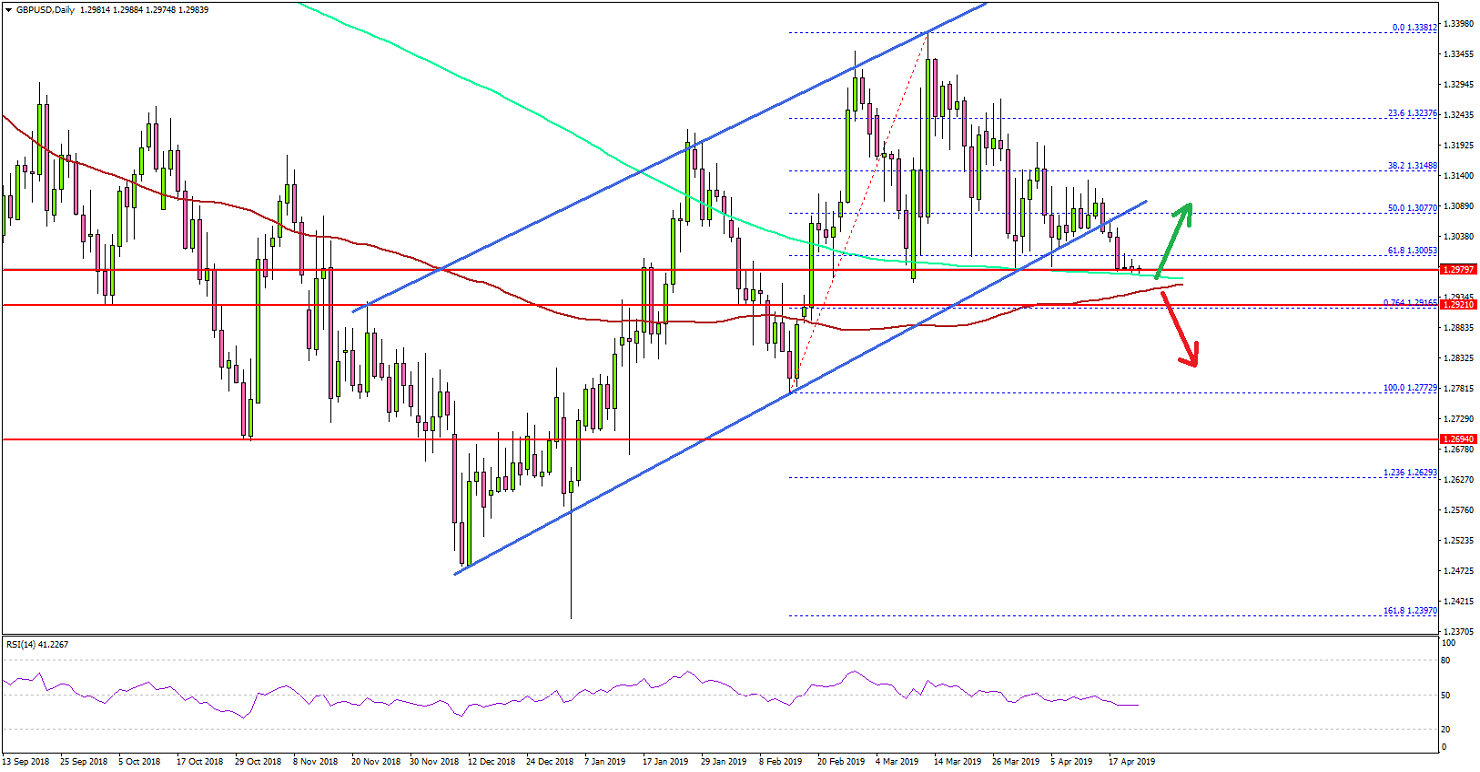
Looking at the daily chart, there are many bearish signsvisible below the 1.3080 support area. The pair even broke a major bullishtrend line with support at 1.3070, opening the doors for more losses.
During the decline, the pair traded below the 50% Fibretracement level of the last major wave from the 1.2772 low to 1.3381 high.The pair even broke the 1.3000 support recently, plus the 61.8% Fib retracementlevel of the last major wave from the 1.2772 low to 1.3381 high.
These all are negative signs, suggesting more losses belowthe 1.2950 level. However, there is a major support waiting on the downsidenear the 1.2940 level and the 100-day simple moving average (red).
Only if there is a daily close below the 100-day simplemoving average (red), the pair could decline further towards the 1.2800 supportarea. Conversely, the pair could bounce back sharply after testing or forming asupport near the 100-day SMA.
Fundamentally, the US Existing Home Sales report for March2019 was released by the National Association of Realtors. The market waslooking for a decline of 2.3% in sales in March 2019, compared with theprevious month.
The actual result was disappointing as there was a declineof 4.9% in the US Existing Home Sales. The last reading was also revised downfrom +11.8% to +11.2%.
Commenting on the report, Lawrence Yun, NAR’s chiefeconomist, stated:
It is not surprising to see a retreat after a powerful surge in sales in the prior month. Still, current sales activity is underperforming in relation to the strength in the jobs markets. The impact of lower mortgage rates has not yet been fully realized.
Overall, GBP/USD remains at a risk of more losses if itfails to stay above the 100-day SMA and 1.2950 in the next few days.
Economic Releases to Watch Today
- US Housing Price Index for Feb 2019 (MoM) -Forecast +0.3%, versus +0.6% previous.
- US New Home Sales for March 2019 (MoM) –Forecast 0.0650M, versus 0.667M previous.
- Euro Zone Consumer Confidence April 2019(Preliminary) – Forecast -7.1, versus -7.2 previous.