
Aayush Jindal
Key Highlights
- The Euro made a nice upside move this past week and traded above 1.2300 against the US Dollar.
- There is a connecting bullish trend line forming with current support at 1.2200 on the 4-hours chart of EUR/USD.
- There are many supports on the downside such as 1.2110 and 1.2080.
- Today in the US, the Chicago Fed National Activity Index (CFNAI) for Dec 2017 will be released, which is forecasted to increase from 0.15 to 0.44.
EURUSD Technical Analysis
The Euro enjoyed a decent uptrend this past week as it broke the 1.2200 and 1.2300 resistances against the US Dollar. The EUR/USD pair traded as high as 1.2322 and is currently corrected lower.
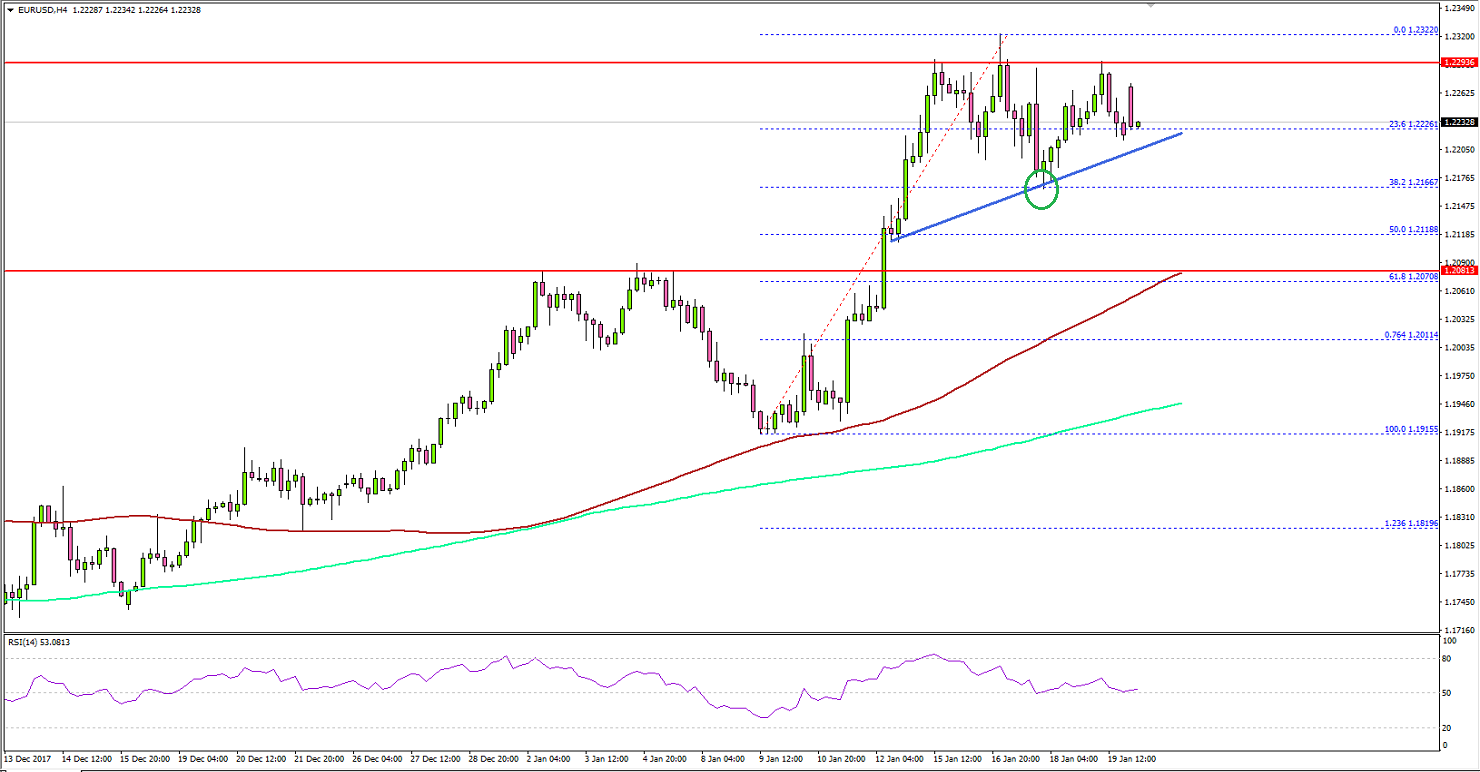
It already tested the 38.2% Fib retracement level of the last wave from the 1.1915 low to 1.2322 high. On the downside, there is a connecting bullish trend line forming with current support at 1.2200 on the 4-hours chart.As long as the pair is above the 1.2200 support, it could bounce back toward 1.2300 in the near term. Should there be a break below the 1.2200 support, the pair possibly will decline toward the 50% Fib retracement level of the last wave from the 1.1915 low to 1.2322 high around 1.2110.Below the mentioned 1.2110, there is a horizontal support at 1.2080. The stated 1.2080 level was a resistance earlier, and now it is likely to act as a good support and buy zone.On the upside, a minor resistance is at 1.2250. The first significant resistance is at 1.2290 followed by the recent high of 1.2320.The current bias is bullish with an immediate support at 1.2200. A break below 1.2200 would call for an extended correction toward 1.2110 or 1.2080. Fundamentally, there is no market moving event lined up today in the US, except a low risk data release i.e. Dec’s Chicago Fed National Activity Index (CFNAI).The market is looking for a minor increase in the index from 0.15 to 0.44, but it may hardly impact the greenback and EUR/USD.On the other hand, USD/JPY is holding the 110.50-60 support area. However, the pair has to gain pace above 111.00 and 111.40 to avoid any further declines.