
Aayush Jindal
Key Highlights
- Gold price started a downside correction fromthe $1,450 resistance against the US Dollar.
- A crucial bullish trend line is forming withsupport near $1,418 on the 4-hours chart of XAU/USD.
- The US Personal Income in June 2019 increased0.4% (MoM), similar to the forecast.
- The US ADP Employment could change by 150K inJuly 2019, more than the last 102K.
Gold Price Technical Analysis
Earlier this month, gold price climbed higher above the $1,400 and $1,440 resistances against the US Dollar. The price tested the $1,450 resistance area and later started a downside correction.
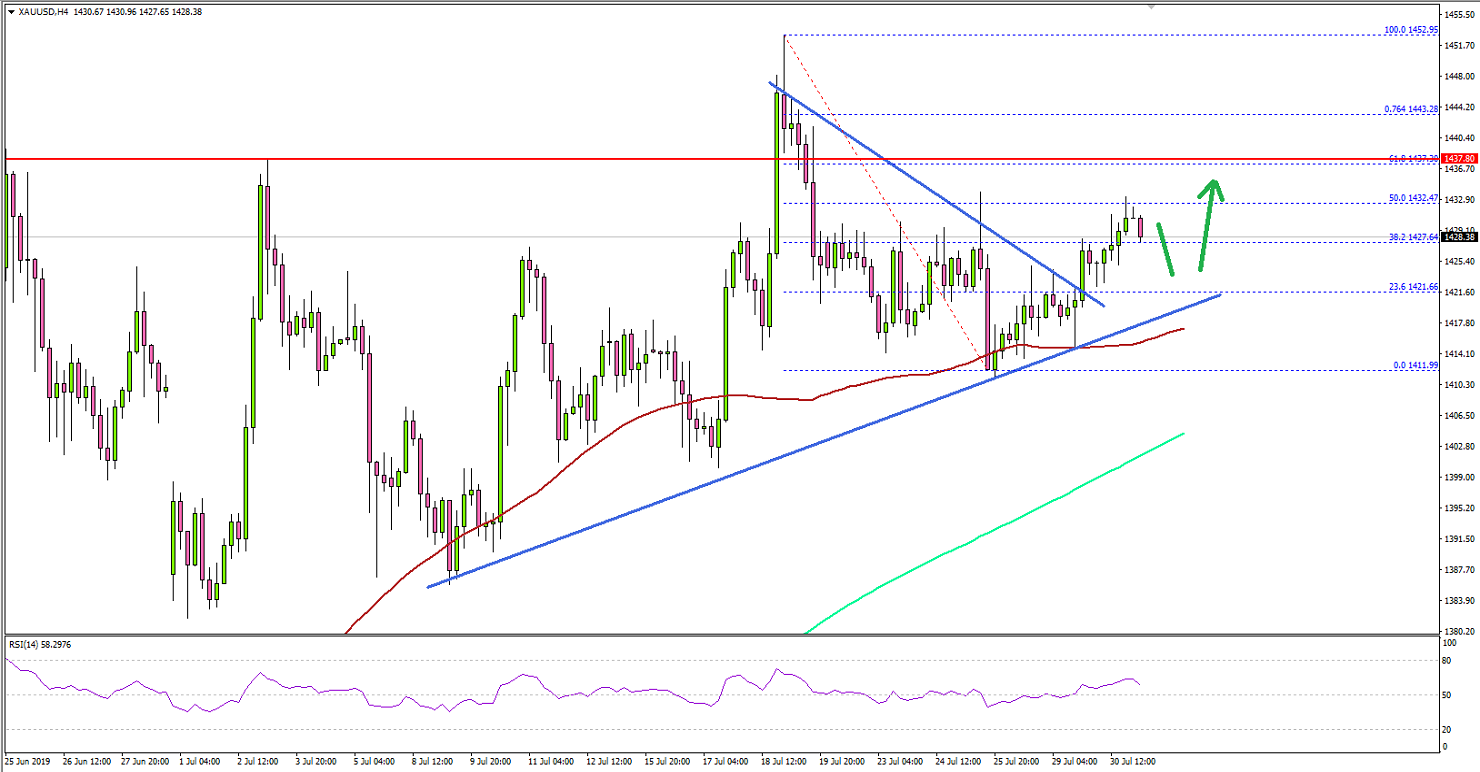
The 4-hours chart of XAU/USD indicates that the price toppednear the $1,452 level and corrected below the $1,440 and $1,420 support levels.However, the price remained well above the $1,400 support and stayed above the 100simple moving average (4-hours, red).
A swing low was formed near $1,411 and the price recentlyclimbed above the $1,420 level. It traded above the 38.2% Fib retracement levelof the downward move from the $1,452 high to $1,411 swing low.
Moreover, there was a break above a connecting bearish trendline with resistance near $1,421. On the upside, an initial hurdle is near the$1,432 level plus the 50% Fib retracement level of the downward move from the$1,452 high to $1,411 swing low.
A successful close above $1,432 and $1,435 might open thedoors for a fresh increase towards $1,450 in the near term. On the downside,there are important supports forming near $1,418 and $1,415.
There is also a crucial bullish trend line forming withsupport near $1,418 on the same chart. Below the trend line and the 100 SMA,the price could test the main $1,400 support area.
Fundamentally, the US Personal Income report for June 2019was released by the Bureau of Economic Analysis, Department of Commerce. Themarket was looking for a 0.4% rise in the personal income compared with theprevious month.
The actual result was similar to the forecast, as the US PersonalIncome increased 0.4%. On the negative side, the last reading was revised downfrom 0.5% to 0.4%.
The report added:
Personal income increased $83.6 billion (0.4 percent) in June according to estimates released today by the Bureau of Economic Analysis. Disposable personal income (DPI) increased $69.7 billion (0.4 percent) and personal consumption expenditures (PCE) increased $41.0 billion (0.3 percent).
Overall, gold price remains in an uptrend unless there is a daily close below $1,400. Looking at major pairs, EUR/USD and GBP/USD seems to be preparing for a short term upside correction.
Economic Releases to Watch Today
- Euro Zone GDP for Q2 2019 (Prelim) (QoQ) -Forecast 0.2%, versus 0.4% previous.
- Euro Zone CPI for July 2019 (YoY) (Prelim) -Forecast +1.1%, versus +1.3% previous.
- Euro Zone Core CPI for July 2019 (YoY) (Prelim)- Forecast +1.0%, versus +1.0% previous.
- US ADP Employment Change for July 2019 -Forecast 150K, versus 102K previous.