Aussie Dollar climbed higher during the past session against the Japanese Yen, but facing a major resistance area.
There is a bearish trend line formed on the hourly chart of AUDJPY, which is preventing an upside break.
Australian Conference Board Australia leading Index released by the Conference Board posted a decline of 0.1% in October 2015, a bit less than the last -0.3%.
BOJ Meeting Minutes were released earlier during the Asian session, which failed to help the Japanese Yen.
AUDJPY Technical Analysis
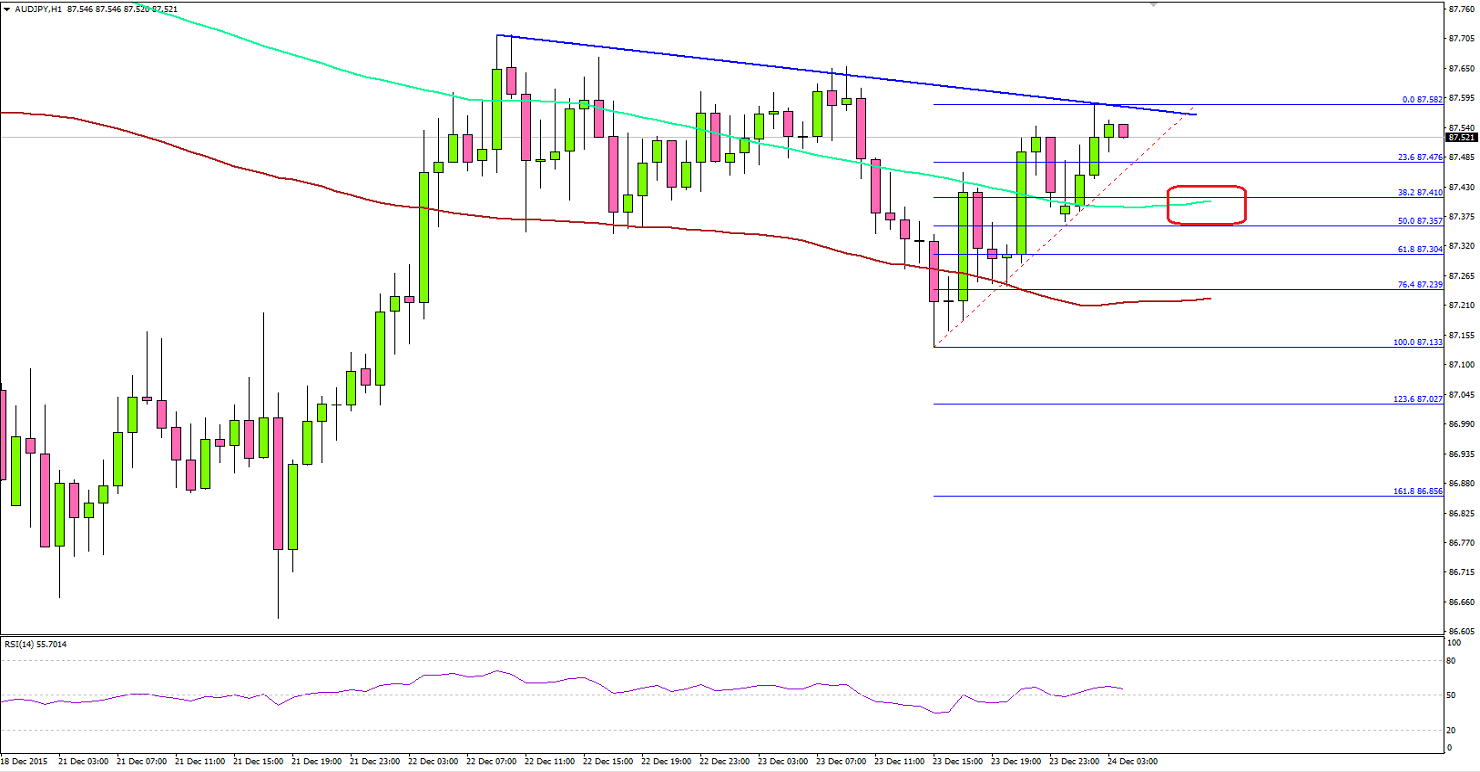
The Aussie Dollar managed to recover from the 87.13 low against the Japanese Yen, and currently trading higher. There is a bearish trend line formed on the hourly chart of AUDJPY, which is acting as a barrier for buyers and preventing the upside move.The highlighted trend line and resistance area acted as a barrier on a number of occasions, and may continue to do so. If buyers succeed in taking the pair above the trend line and resistance area, then more gains are feasible.The next stop on the upside can be seen around the 88.00 level. No doubt, there are many positive signs, which can lead to a break higher in the pair.On the downside, the 200 hourly simple moving average may act as a support area, as it is coinciding with the 38.2% Fib retracement level of the last leg from the 87.13 low to 87.58 high. The hourly RSI is above the 50 level, which is a bullish sign for bulls.
Conference Board Australia leading Index
Today during the Asian session, the Conference Board Australia leading Index, which measures future trends of the overall economic activity including employment, average manufacturing workweek, initial claims and others was released by the Conference Board. The market was not expecting any major increase from the last decline of 0.3% (revised).The outcome was better, as the decline in the index was limited by 0.1% in October 2015. The report helped the Aussie Dollar to gain bids.Today, there can be less volatility in the market due to holidays. Traders trading in the silent market should be careful, as there can be nasty moves, which can impact your positions. Low volatility often surprises the market.

 The highlighted trend line and resistance area acted as a barrier on a number of occasions, and may continue to do so. If buyers succeed in taking the pair above the trend line and resistance area, then more gains are feasible.The next stop on the upside can be seen around the 88.00 level. No doubt, there are many positive signs, which can lead to a break higher in the pair.On the downside, the 200 hourly simple moving average may act as a support area, as it is coinciding with the 38.2% Fib retracement level of the last leg from the 87.13 low to 87.58 high. The hourly RSI is above the 50 level, which is a bullish sign for bulls.