
Aayush Jindal
Key Highlights
- The British Pound remains in a bearish zonebelow 1.3200 against the US Dollar.
- A crucial bearish trend line is formed withresistance at 1.3140 on the 4-hours chart of GBP/USD.
- The US Factory Orders declined 0.5% in Feb 2019(MoM), better than the -0.6% forecast.
- The US NFIB Business Optimism Index in March 2019might decline from 101.7 to 101.3.
GBPUSD Technical Analysis
The British Pound failed to break the 1.3200 resistance this past week and later declined against the US Dollar. The GBP/USD pair is trading above the 1.3000 support, but it is facing many hurdles near 1.3150.
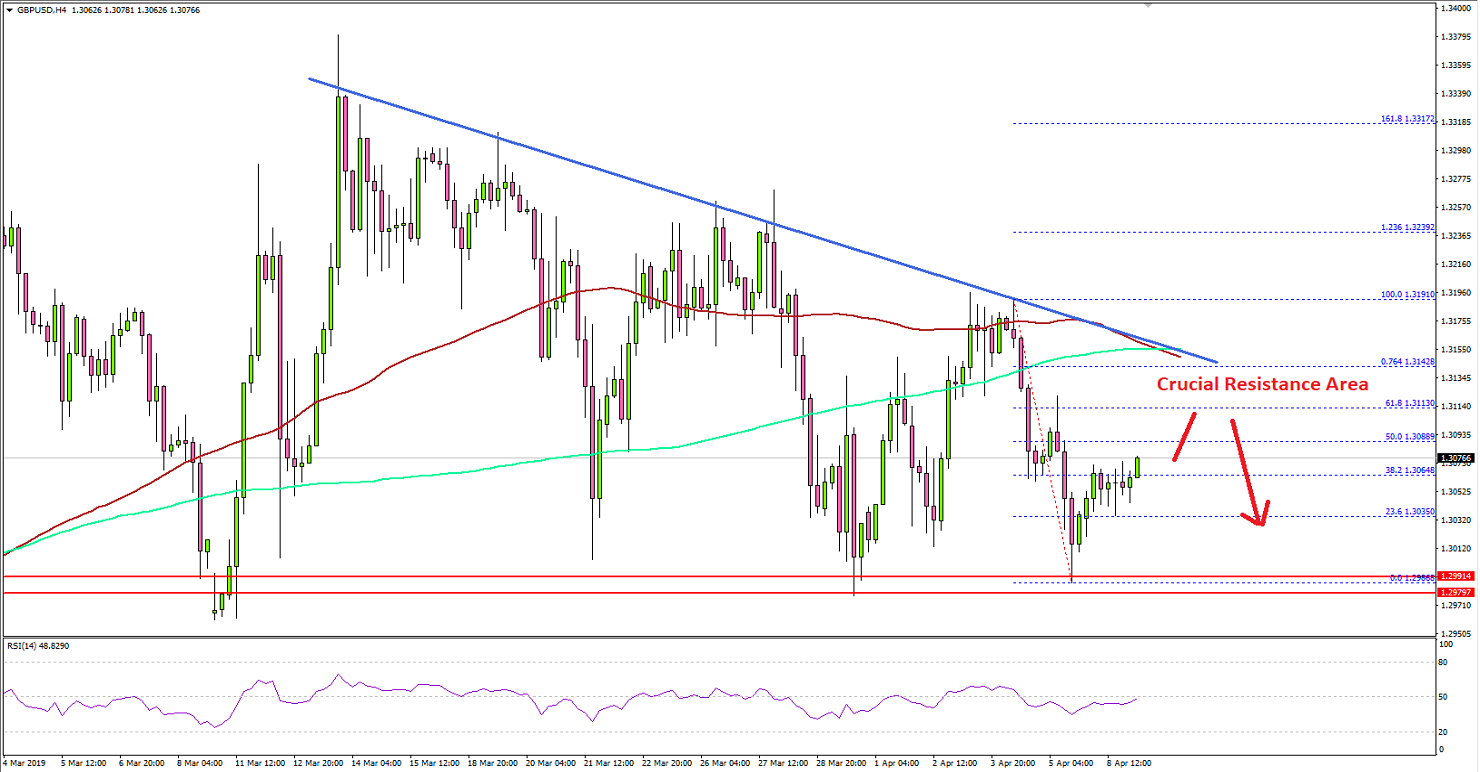
Looking at the 4-hours chart, the pair traded as high as1.3191 and later declined sharply below the 1.3150 and 1.3100 support levels. Thepair even broke the 1.3060 support and settled below the 100 simple movingaverage (4-hours, red) plus the 200 simple moving average (4-hours, green).
The pair revisited the 1.2990-1.3000 support area, wherebuyers emerged. Later, GBP/USD started consolidating losses and corrected abovethe 23.6% Fib retracement level of the last decline from the 1.3191 high to 1.2986low.
To the upside, there are many resistances near the 1.3100and 1.3150 levels. The first hurdle near 1.3100 is just above the 50% Fibretracement level of the last decline from the 1.3191 high to 1.2986 low.
There is also a crucial bearish trend line formed withresistance at 1.3140 on the same chart, coinciding with the 100 and 200 SMA’s.Therefore, a successful break above the 1.3150 resistance is needed to start asolid rebound.
On the other hand, if the pair fails to surpass the 1.3100and 1.3150 resistances, there is a risk of a sustained drop below the1.2990-1.3000 support area.
Fundamentally, the US Factory Orders report for Feb 2019 wasreleased by the US Census Bureau. The market was looking for a 0.6% drop inorders, compared with the previous month.
The actual result was better than the forecast, as the USFactory Orders declined 0.5%. Moreover, the last reading was revised down from+0.1% to 0%. The overall result was negative since the new orders declined fourof the last five months.
To sum up, GBP/USD is closing in towards the next key breakeither above the 1.3150 resistance area or below the 1.3000 support zone.
Economic Releases to Watch Today
- UK BRC Like-For-Like Retail Sales March 2019(YoY) - Forecast +0.1%, versus -0.1% previous.
- US NFIB Business Optimism Index March 2019 –Forecast 101.3, versus 101.7 previous.
- US IBD/TIPP Economic Optimism Index April 2019(MoM) - Forecast 54.2, versus 55.7 previous.