
Nick Goold
Understanding the balance between buyers and sellers is at the core of trading. Every move in the market comes from this constant battle. The Bears and Bulls Power Indicator is designed to help traders measure that balance and identify when one side is gaining control.
This indicator is particularly useful for traders who want to move beyond simple price action and better understand the strength behind market moves. Instead of just seeing price rise or fall, it shows why it is happening and whether the move is likely to continue.
What Is the Bears and Bulls Power Indicator?
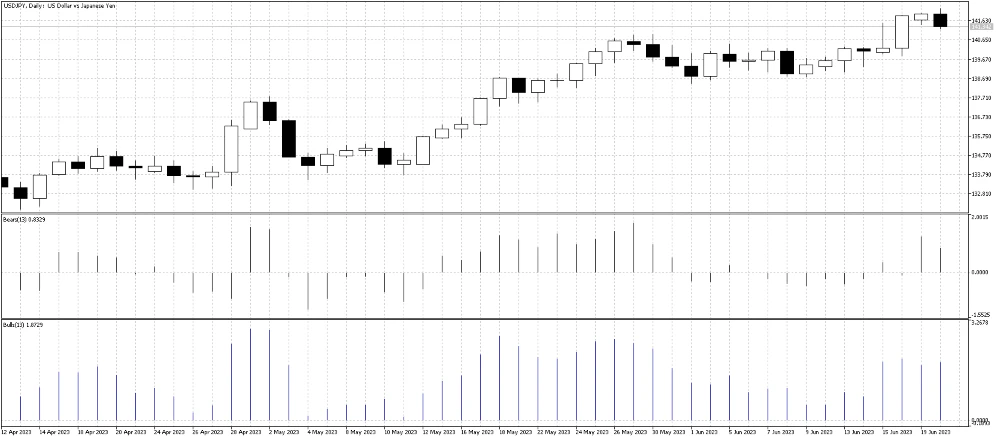
The Bears and Bulls Power Indicator measures buying pressure (bulls) and selling pressure (bears) separately. This gives traders a clearer view of market sentiment rather than relying only on price direction.
When bulls are in control, prices tend to push higher with strength. When bears dominate, prices fall with momentum. The indicator helps you see when that balance starts to shift, which is often where trading opportunities appear.
How the Indicator Is Calculated
The calculation is simple but effective:
- Average price = (High + Low) / 2
- Bulls Power = High − EMA (13)
- Bears Power = Low − EMA (13)
The 13-period Exponential Moving Average (EMA) acts as a baseline. It smooths price data and represents the “fair value” of the market over the short term.
Bulls Power shows how far buyers can push price above this average, while Bears Power shows how far sellers can push price below it. The further these values move from zero, the stronger that side of the market is.
How to Use Bears and Bulls Power in Trading
This indicator is most effective when used to understand momentum and timing rather than as a standalone signal. It works best when combined with basic market structure such as trend direction and key levels.
Spotting Potential Trend Changes
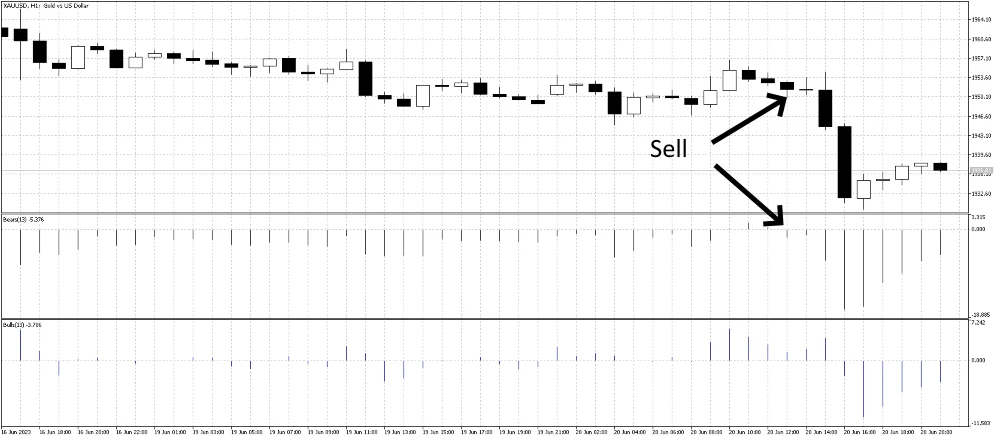
One of the most common uses is identifying when market control is shifting. When Bulls Power moves above zero, it shows that buyers are strong enough to push price above the average. This can be an early sign of bullish momentum building. On the other hand, when Bears Power drops below zero, it suggests sellers are gaining control.
These shifts often happen before clear price trends develop, which makes them useful for early positioning.
Confirming Trend Strength
The indicator becomes more powerful when used to confirm what price is already doing. If price is rising and Bulls Power continues to increase, it shows strong buying pressure supporting the move. This makes the trend more reliable and can justify staying in the trade longer.
Similarly, if price is falling and Bears Power is expanding, it confirms that selling pressure is increasing. In these conditions, pullbacks are more likely to be temporary rather than reversals. This is especially useful for traders who follow trends and want confidence to hold positions rather than exit too early.
Using Divergence for Early Signals
Divergence can provide early warnings that a trend is losing strength. A bullish divergence happens when price makes lower lows, but Bulls Power starts to rise. This suggests that selling pressure is weakening even though price is still falling. Often, this appears near market bottoms.
A bearish divergence occurs when price makes higher highs, but Bears Power weakens. This shows that buyers are losing strength, even as price pushes higher. These situations do not always lead to immediate reversals, but they highlight areas where risk increases and traders should pay closer attention.
Advantages of the Indicator
The Bears and Bulls Power Indicator is popular because it is simple to understand while still providing meaningful insight. It separates buying and selling pressure clearly, which helps traders avoid relying only on price movement. It also works well across different markets, including forex, indices, and commodities.
Another key strength is its ability to highlight momentum shifts early. This can give traders more time to prepare trades instead of reacting late.
Limitations to Be Aware Of
Like most indicators, this tool is based on past price data. That means it reacts to what has already happened, which can sometimes delay signals. There will also be false signals, especially in ranging or low-volatility markets where price moves without clear direction. In these conditions, the indicator may flip between bullish and bearish signals without follow-through.
Interpretation can also vary. Some traders focus on zero-line crossovers, while others rely more on divergence or trend confirmation. Without a clear plan, this can lead to inconsistent decisions.
How to Use It More Effectively
The best way to use the Bears and Bulls Power Indicator is as part of a simple, structured approach. Start with the overall trend. Then use the indicator to confirm whether momentum supports that trend. Finally, look for entries around pullbacks or key levels rather than chasing moves.
Combining it with support and resistance, or even a simple moving average like a 10 SMA, can make the signals much more reliable. Trading is not about reacting to every signal. It is about understanding when conditions align. The Bears and Bulls Power Indicator helps you see that alignment more clearly by showing who is really in control of the market.
