
Nick Goold
Bollinger Bands are one of the most widely used technical indicators in forex trading. Developed by John Bollinger, they provide a dynamic way to understand price movement, volatility, and potential trading opportunities. :contentReference[oaicite:0]{index=0}
Unlike fixed support and resistance levels, Bollinger Bands adjust to market conditions. This makes them especially useful in fast-moving markets where volatility changes frequently.
What Bollinger Bands Show
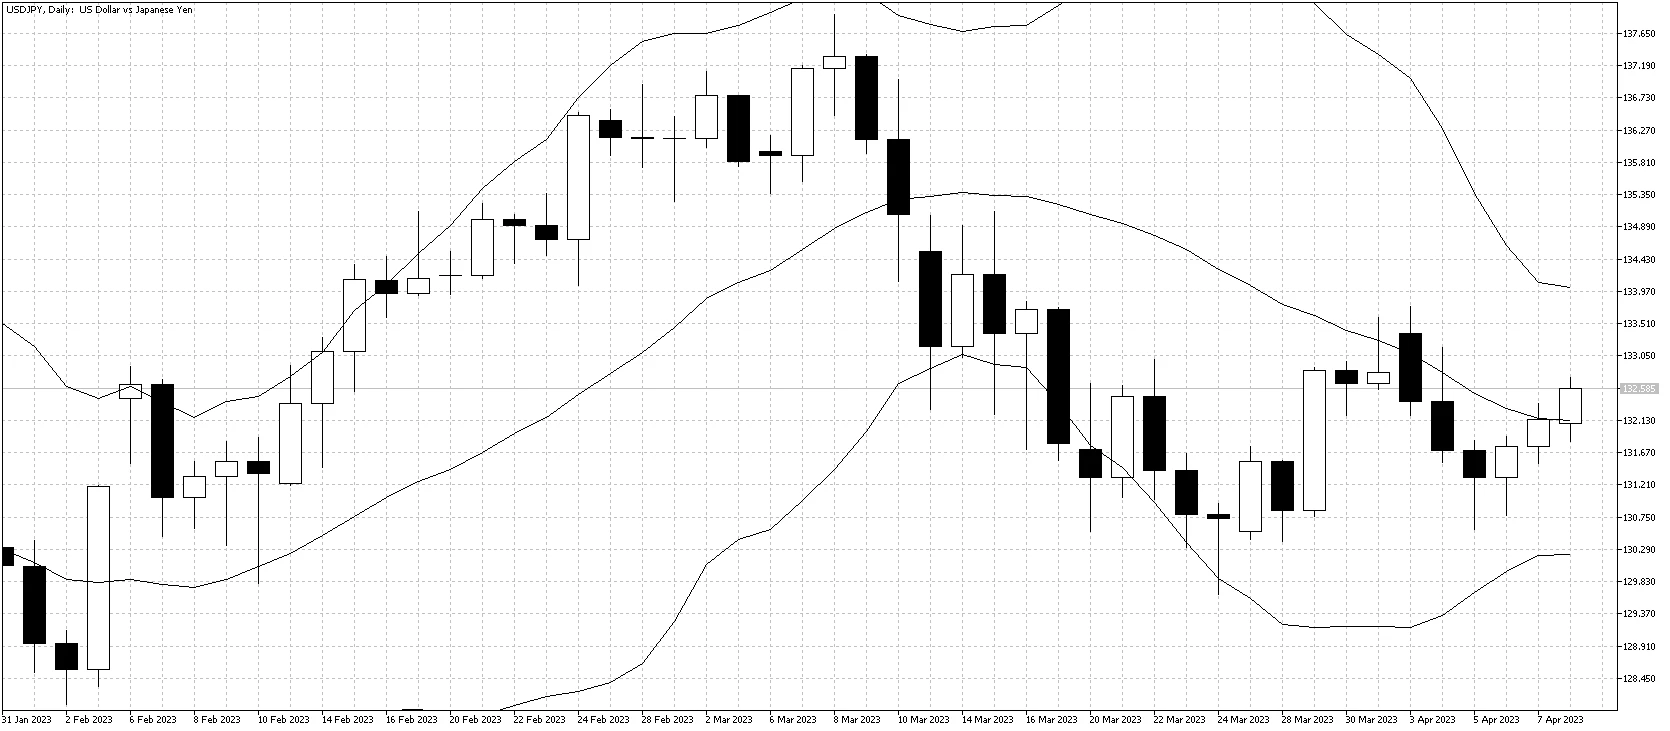
Bollinger Bands consist of three lines that move with price:
- A middle line, typically a 20-period simple moving average
- An upper band based on volatility above the average
- A lower band based on volatility below the average
The distance between the bands changes depending on market volatility. When volatility increases, the bands expand. When the market becomes quiet, they contract. This simple behavior gives traders valuable information about market conditions.
Understanding Volatility and Market Conditions
Bollinger Bands are not just about overbought or oversold levels. Their main strength is showing how active the market is. When the bands are wide, the market is volatile and moving strongly. When they are narrow, the market is quiet and often preparing for a larger move.
This shift between expansion and contraction is where many trading opportunities appear.
Using Bollinger Bands as Dynamic Support and Resistance
One of the simplest ways to use Bollinger Bands is to treat them as moving support and resistance levels.
In ranging markets, price often reacts near the outer bands:
- Price near the lower band may attract buyers
- Price near the upper band may attract sellers
This approach works best when the market is not trending strongly. In trending conditions, price can stay near one band for extended periods, so this method becomes less reliable.
Trading the Bollinger Band Squeeze
The squeeze is one of the most popular Bollinger Band strategies. It occurs when the bands move very close together, indicating low volatility. This often happens before a strong move.
Instead of predicting direction, traders wait for confirmation.
- A break above the upper band may signal a bullish move
- A break below the lower band may signal a bearish move
The key idea is that quiet markets often lead to strong expansions.

Breakouts After Volatility Expansion
Another approach focuses on what happens after volatility increases. When the bands begin to widen, it shows that the market is becoming more active. If price breaks out during this expansion, it can lead to strong trend movements.
This is often more reliable than trading during quiet conditions because momentum is already building.

Combining Bollinger Bands with RSI
Bollinger Bands become more effective when combined with simple indicators.
The RSI is commonly used to confirm overbought and oversold conditions.
- Price at the upper band with RSI above 70 may signal a potential sell setup
- Price at the lower band with RSI below 30 may signal a potential buy setup
This combination helps avoid taking trades based on price alone.

Using Bollinger Bands with Other Indicators
Traders often combine Bollinger Bands with other tools to improve accuracy.
For example:
- Stochastic can help identify short-term reversals
- Moving averages can confirm the overall trend direction
- Fibonacci levels can highlight key reaction areas
This approach helps filter out weaker signals and improves decision-making.

Common Mistakes When Using Bollinger Bands
Many traders misuse Bollinger Bands by assuming price will always reverse at the outer bands. In strong trends, price can remain near the upper or lower band for extended periods. Selling too early in an uptrend or buying too early in a downtrend can lead to repeated losses.
Another mistake is trading without considering volatility. The bands provide context, not standalone signals.
Building a Simple Bollinger Band Strategy
The most effective approach is to keep things simple.
Start by identifying the market condition:
- Ranging market: use bands for support and resistance
- Trending market: look for breakouts and continuation setups
Then confirm your setup using one additional tool, such as RSI or a moving average. This keeps your decision process clear and avoids overcomplication.
Using Bollinger Bands Consistently
Bollinger Bands are not about predicting exact turning points. They help you understand when the market is quiet, when it is active, and when conditions are changing. By focusing on volatility, structure, and confirmation, traders can use Bollinger Bands to improve timing, manage risk, and stay aligned with market conditions.
With practice, they become a reliable tool for identifying both breakout opportunities and controlled trading setups.
