
Nick Goold
The momentum indicator is one of the simplest but most effective tools for understanding how strongly the market is moving. While many traders focus only on price levels, momentum adds another layer by showing the speed behind those moves.
In forex trading, this matters because strong moves tend to continue, while weak moves often reverse or stall. By measuring momentum, you can better judge whether a trend is worth following or if it is starting to lose strength. This guide explains how the momentum indicator works and how to use it to improve your entries, exits, and overall trade decisions.
What the Momentum Indicator Shows
The momentum indicator measures how much price has changed over a specific period. Instead of focusing only on direction, it shows how fast price is moving.
When momentum is rising, it suggests that buying or selling pressure is increasing. When momentum is falling, it indicates that the move is losing strength. This makes it a useful tool for confirming trends and identifying potential turning points before they become obvious on the chart.
How the Momentum Indicator Works
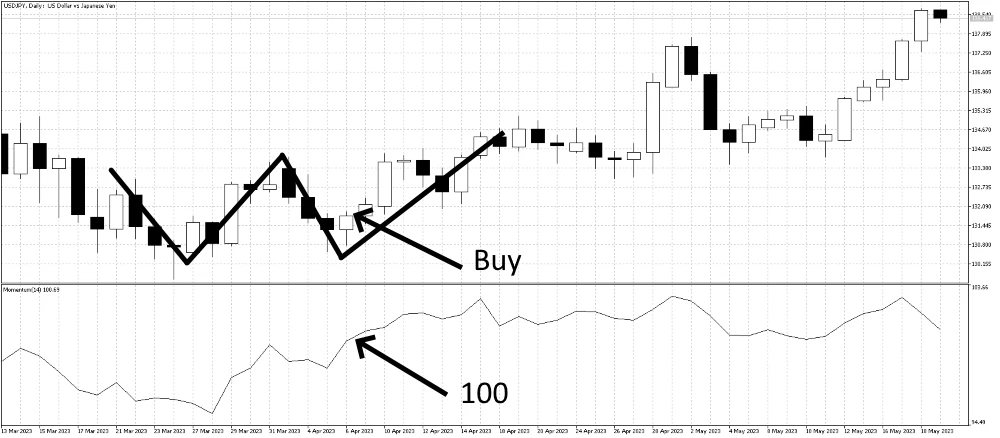
The calculation is straightforward. It compares the current price to the price from a set number of periods ago. This creates a line that moves above and below a central level, usually set at 100.
When the indicator is above this level, upward momentum is stronger. When it is below, downward momentum is dominant. Traders can adjust the number of periods depending on how sensitive they want the indicator to be. Shorter settings react faster but can produce more noise. Longer settings are smoother but may react more slowly to changes.
Reading Momentum in Trending Markets
Momentum is most useful when combined with trend analysis. In a strong uptrend, the indicator should generally stay above its centerline and continue making higher highs.
In a downtrend, it should remain below the centerline and reflect consistent selling pressure. If price is trending but momentum starts to weaken, it can be an early sign that the trend is losing strength. This does not always mean an immediate reversal, but it does signal that risk is increasing.
Using Crossovers for Trade Signals

One of the most common ways to use the momentum indicator is through crossovers. When the indicator moves above the centerline, it suggests that upward momentum is building. This can support long positions, especially when aligned with the overall trend.
When it moves below the centerline, it indicates increasing downward momentum and can support short positions. These signals are more reliable when they occur in the direction of the trend rather than against it.
Spotting Divergence Before Reversals
Divergence is one of the most valuable signals the momentum indicator provides. It occurs when price and momentum move in different directions. For example, if price continues to make new highs but momentum fails to do the same, it suggests that the move is weakening. This can often lead to a pullback or reversal.
Similarly, if price makes new lows while momentum starts to rise, it may indicate that selling pressure is fading. Divergence does not guarantee a reversal, but it helps you prepare for a possible change in market direction.
Combining Momentum with Price Structure
The momentum indicator becomes more effective when combined with price patterns such as support and resistance or chart formations.
For example, a double bottom pattern supported by rising momentum provides stronger confirmation than the pattern alone. This combination helps filter out weaker setups and focus on higher-quality trades. Instead of relying on the indicator alone, using it alongside price structure creates a more balanced approach.
Using Momentum for Trade Management
Momentum is not just useful for entries. It can also help you manage trades once you are in a position. If momentum starts to slow while price is still moving in your favor, it may be a signal to take partial profits or tighten your stop. This allows you to protect gains before the market turns.
It can also help you avoid entering trades too late. If momentum is already fading, the move may be near its end, even if price still looks strong.
Focus on Profit vs Loss, Not Just Win Rate
The momentum indicator is not designed to give perfect signals. Its value comes from helping you understand the strength behind price movement.
When combined with trend analysis and clear risk management, it can improve the quality of your trades. More importantly, it helps you avoid low-probability setups where momentum is weak or unclear.
Trading performance depends on managing risk and capturing strong moves. The momentum indicator supports this by highlighting when the market is moving with strength and when it is not. Used with discipline, it becomes a practical tool for improving timing, confirming trends, and making more informed trading decisions.
