
Aayush Jindal
Key Highlights
- Gold started a fresh upward move above the $2,625 resistance.
- A key bullish trend line is forming with support at $2,620 on the 4-hour chart.
- Oil prices could continue to rise if there is a close above the $75.00 resistance.
- The US ADP employment could change by 140K in Dec 2024.
Gold Price Technical Analysis
Gold prices remained well-bid near the $2,600 zone against the US Dollar. The price formed a base and started a fresh increase above $2,610 and $2,615.
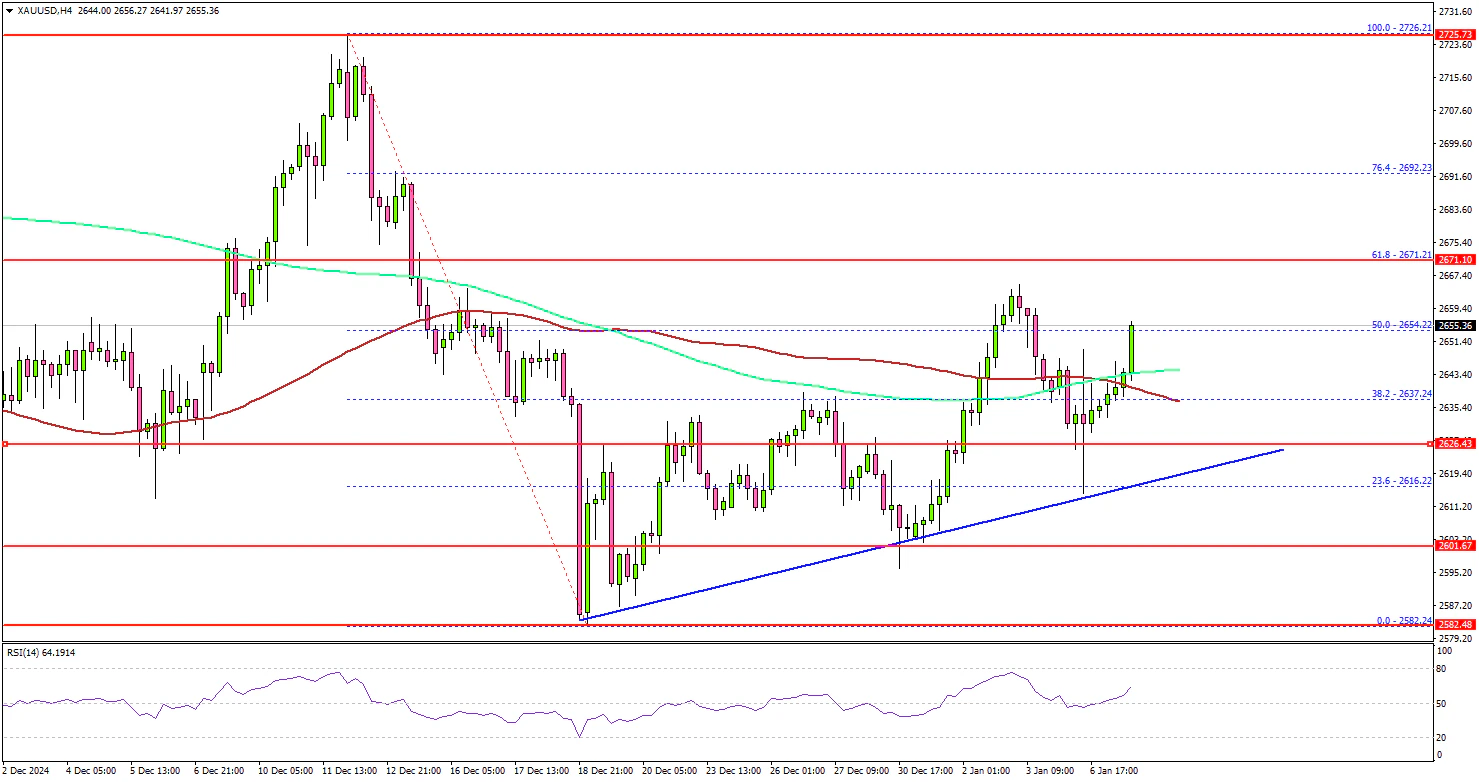
The 4-hour chart of XAU/USD indicates that the price even climbed above $2,620 to move into a positive zone. There was a clear move above the 50% Fib retracement level of the downward move from the $2,726 swing high to the $2,582 low.
The price surpassed the 100 Simple Moving Average (red, 4 hours) and the 200 Simple Moving Average (green, 4 hours). On the upside, immediate resistance is near the $2,670 level or the 61.8% Fib retracement level of the downward move from the $2,726 swing high to the $2,582 low.
The next major resistance sits near the $2,692 level. A clear move above the $2,692 resistance could open the doors for more upsides. The next major resistance could be $2,700, above which the price could rally toward the $2,720 level.
On the downside, initial support is near the $2,635 level. The first key support is near $2,620. There is also a bullish trend line forming with support at $2,620 on the same chart.
The next major support is near the $2,600 level. The main support is now $2,580. A downside break below the $2,580 support might call for more downsides. The next major support is near the $2,550 level.
Looking at Oil, there was a decent increase, and the bulls might aim for a close above the $75.00 resistance level.
Economic Releases to Watch Today
- US ADP Employment Change for Dec 2024 - Forecast 140K, versus 146K previous.
- FOMC Meeting Minutes.
