
Aayush Jindal
Key Highlights
- The British Pound struggled to gain momentumabove 1.2550 against the US Dollar.
- GBP/USD is struggling to trade above a key bearishtrend line near 1.2515 on the 4-hours.
- The Chicago Fed National Activity Index (CFNAI)increased from -0.03 to -0.02 in June 2019.
- The US Housing Price Index in May 2019 couldrise 0.3% (MoM), less than the last +0.4%.
GBPUSD Technical Analysis
The British Pound started an upside correction from the 1.2381 low against the US Dollar. The GBP/USD pair traded above the 1.2460 and 1.2500 resistance levels, but it struggled to gain traction above 1.2550.
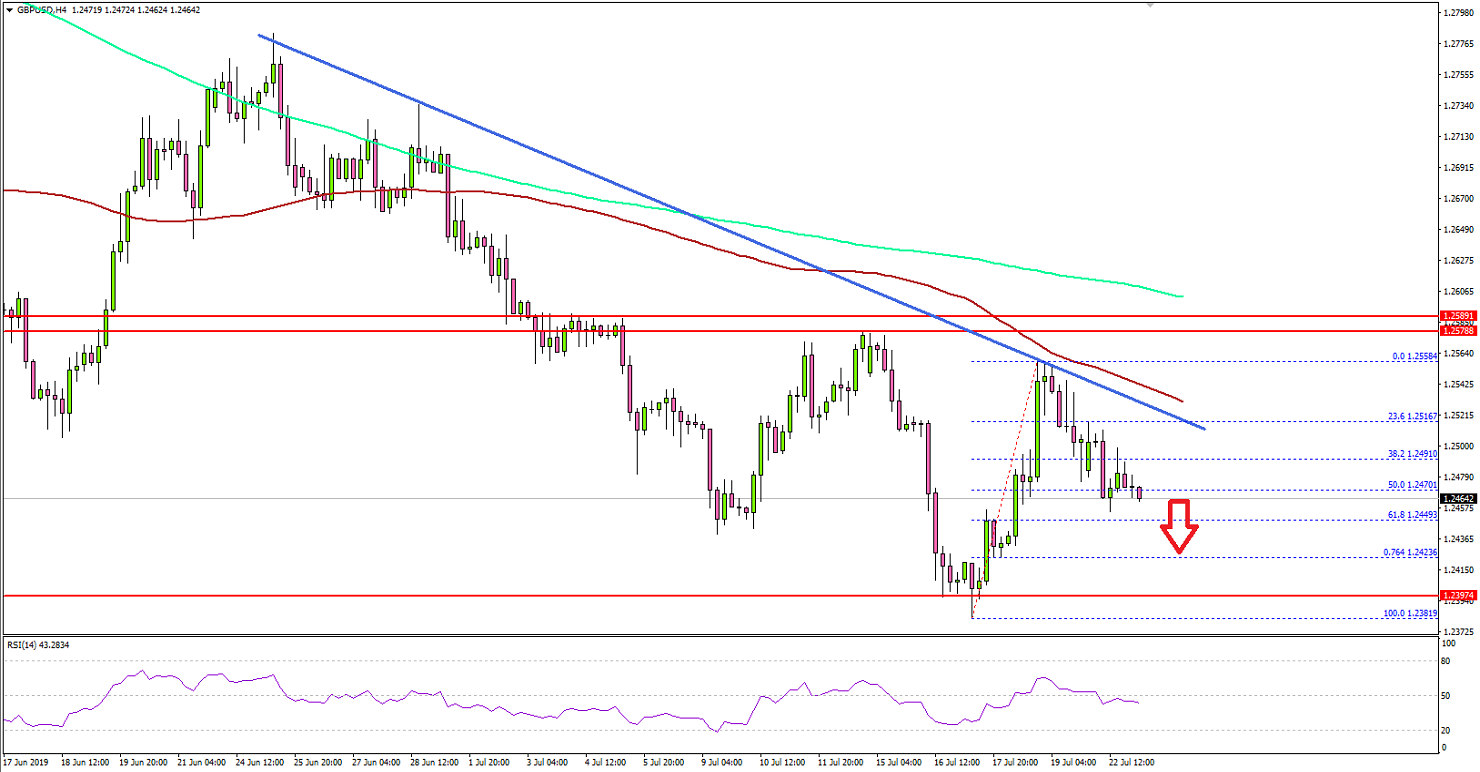
Looking at the 4-hours chart, the pair failed below asignificant resistance area near 1.2575 plus the 100 simple moving average(red, 4-hours). A swing high was formed near 1.2558 before the price trimmedgains.
It traded below the 1.2500 support plus the 50% Fibretracement level of the upward move from the 1.2381 low to 1.2558 high. On thedownside, the main supports are near 1.2445 and 1.2415, below which there is arisk of more losses.
If GBP/USD slides below 1.2400 once again this week, itcould trade to a new monthly low below 1.2380. Conversely, the pair needs toclimb above the 1.2550 and 1.2575 resistance levels plus settle above the 100simple moving average (red, 4-hours) to start a strong rise.
If there is a successful close above the 1.2575 resistance,the pair might attempt to break the 1.2600 resistance plus the 200 simplemoving average (green, 4-hours).
Fundamentally, the Chicago Fed National Activity Index(CFNAI) for June 2019 was released by Federal Reserve Bank of Chicago. Themarket was looking for an increase from -0.05 to 0.10.
However, the actual result was disappointing as the indexincreased to -0.02. The last reading was revised up from -0.05 to -0.03, butthe overall increase was very less.
The report added:
One of the four broad categories of indicators that make up the index increased from May, and two of the four categories made negative contributions to the index in June. The index’s three-month moving average, CFNAI-MA3, ticked up to –0.26 in June from –0.27 in May.
Overall, GBP/USD is facing a few key resistances near 1.2550and 1.2575, above which the pair could start a solid increase in the near term.
Economic Releases to Watch Today
- US Housing Price Index for May 2019 (MoM) -Forecast +0.3%, versus +0.4% previous.
- US Existing Home Sales for June 2019 (MoM) -Forecast +0.2%, versus +2.5% previous.
