
Aayush Jindal
Key Highlights
- The British Pound declined heavily and broke the 1.2660 support against the US Dollar.
- There are two important bearish trend lines formed with resistance near 1.2775 on the 4-hours chart of GBP/USD.
- The UK Industrial Production in Nov 2018 declined 0.6% (MoM), whereas the market was looking for a 0.1% rise.
- Today, the UK Claimant Count figure for Nov 2018 will be released, which is forecasted to post a change of 13.2K.
GBPUSD Technical Analysis
After forming a top near the 1.3180 level, the British Pound started a major decline against the US Dollar. The GBP/USD pair traded below the 1.3000 and 1.2800 support levels to enter a major downtrend.
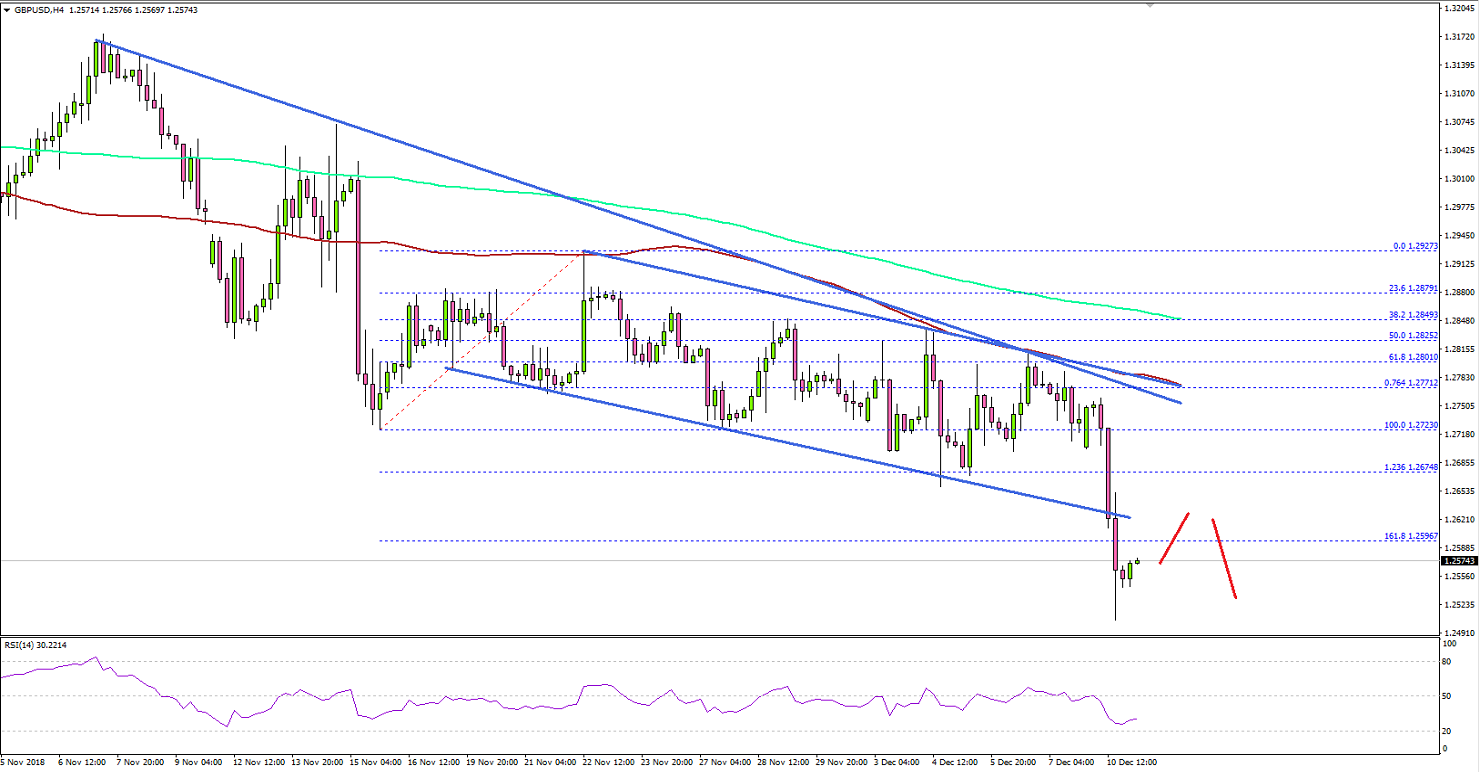
Looking at the 4-hours chart, the last swing low was formed at 1.2723 and later the pair corrected higher. It moved above the 1.2800 and 1.2900 levels, but buyers failed near 1.2930. Later, a fresh decline was initiated and the pair declined steadily below the 1.2800 and 1.2700 support levels.The decline was such that the pair settled below the 1.2680 support, the 200 simple moving average (green, 4-hours), and the 100 simple moving average (red, 4-hours).Moreover, there was a break below the 1.618 Fib extension level of the last wave from the 1.2723 low to 1.297 high. Therefore, there is a risk of more losses below the 1.2560 support level in the near term.On the upside, there is a crucial resistance formed near 1.2750 and the 100 SMA. Besides, there are two important bearish trend lines formed with resistance near 1.2775 on the same chart.Overall, as long as GBP/USD is trading below the 1.2770 and 1.2800 resistance levels, it remains in a downtrend. Above 1.2800, the pair may bounce back towards 1.3000.Fundamentally, the UK Industrial Production for Nov 2018 was released by the National Statistics. The market was looking for a 0.1% rise in the UK Industrial Production compared with the previous month.However, the result was disappointing as there was a 0.6% decline in the production. Looking at the yearly change, there was a 0.8% drop, whereas the market was looking for -0.2%. The report added:
The monthly decrease in manufacturing output of 0.9% was due mainly to weakness from transport equipment, falling by 3.2% and pharmaceutical products, falling by 5.0%; 5 of the 13 manufacturing subsectors increased.
It impacted the British Pound and pushed GBP/USD lower. If buyers fail to hold the 1.2560 support, there could be a sharp decline in the near term.
Economic Releases to Watch Today
- UK Claimant Count Change Nov 2018 – Forecast 13.2K, versus 20.2K previous.
- UK ILO Unemployment Rate Oct 2018 (3M) – Forecast 4.1%, versus 4.1% previous.
- US Producer Price Index Nov 2018 (MoM) – Forecast 0%, versus +0.6% previous.
- US Producer Price Index Nov 2018 (YoY) – Forecast +2.5%, versus +2.9% previous.
