
Aayush Jindal
Key Highlights
- The British Pound found support near 1.2980 and recently recovered against the US Dollar.
- A major bearish trend line is in place with resistance at 1.3190 on the 4-hours chart of GBP/USD.
- The UK Manufacturing PMI in March 2019 increased from 52.1 to 55.1.
- The UK Construction PMI for March 2019 is likely to rise from 49.5 to 49.8.
GBPUSD Technical Analysis
This past week, there was a sharp decline in the British Pound from the 1.3270 swing high against the US Dollar. The GBP/USD pair traded below the 1.3120 support level and tested the key 1.2980 support area.
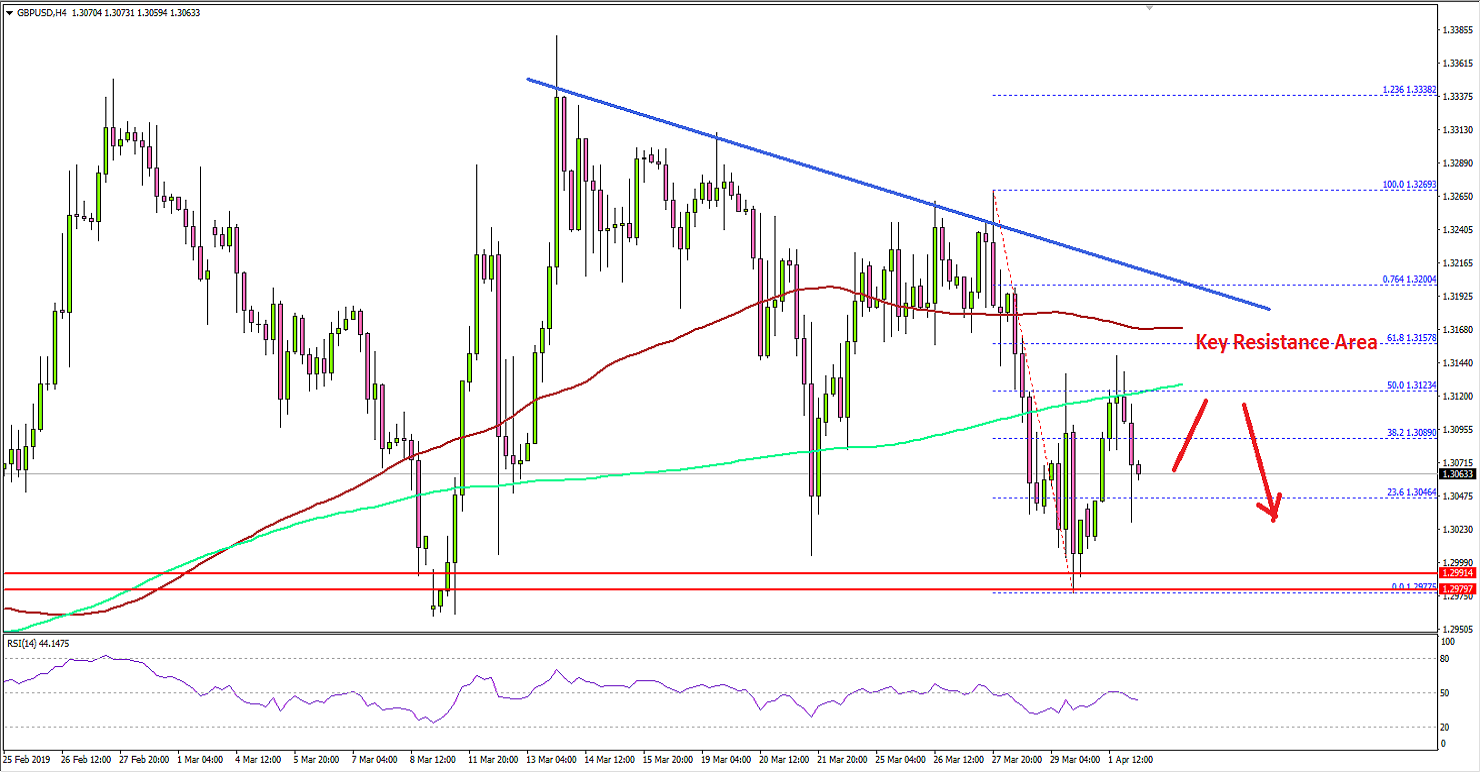
Looking at the 4-hours chart, the pair traded as low as 1.2977 and later rebounded above the 1.3050 resistance. Buyers even pushed the price above the 1.3100 level and cable tested the 50% Fib retracement level of the last decline from the 1.3269 high to 1.2977 low.To the topside, there are many resistances for buyers, starting with the 200 simple moving average (4-hours, green) and 1.3125. The next key resistance is near 1.3160 and the 100 simple moving average (4-hours, red). Besides, the 61.8% Fib retracement level of the last decline from the 1.3269 high to 1.2977 low is also near the 1.3160 level.There is also a major bearish trend line in place with resistance at 1.3190 on the same chart. Therefore, if the pair continues to rise, it is likely to face a strong resistance near 1.3160, 1.3190 and 1.3200.A successful close above 1.3200 might push the pair back in a bullish zone. Conversely, a failure to clear the 1.3160 or 1.3190 resistance could trigger a fresh decline below 1.3050.Fundamentally, the UK Manufacturing PMI for March 2019 was released by both the Chartered Institute of Purchasing & Supply and the Markit Economics. The market was looking for a decline from the last reading of 52.0 to 51.0.The actual result was better than the forecast, as there was a sharp increase in the UK Manufacturing PMI to 55.1. Besides, the last reading was revised up from 52.0 to 52.1.The report added:
Companies stepped up production to build-up inventories in advance of Brexit and also meet rising inflows of new work (mainly reflecting stockpiling at clients). New business improved from both domestic and export markets. This had a positive impact on staff hiring, with jobs growth recorded following back-to-back reductions at the start of the year.
GBP/USD was boosted after the release, but it won’t be easy for buyers to gain bullish momentum above the 1.3160 level.
Economic Releases to Watch Today
- UK’s Construction PMI for March 2019 – Forecast 49.8, versus 49.5 previous.
- US Durable Goods Orders for Feb 2019 – Forecast -1.8% versus +0.3% previous.
