
Aayush Jindal
Key Highlights
- The British Pound failed to settle above 1.2760and recently declined against the US Dollar.
- GBP/USD is likely following a declining patternand it could test the 1.2600 support area.
- The UK Manufacturing PMI in May 2019 declinedfurther from 49.4 to 48.0.
- The UK Construction PMI in May 2019 mightincrease from 48.6 to 49.3.
GBPUSD Technical Analysis
This past week, the British Pound made another attempt to climb above the 1.2760 and 1.2780 resistance levels. However, the GBP/USD pair failed to continue higher, topped at 1.2783, and recently declined below 1.2700.
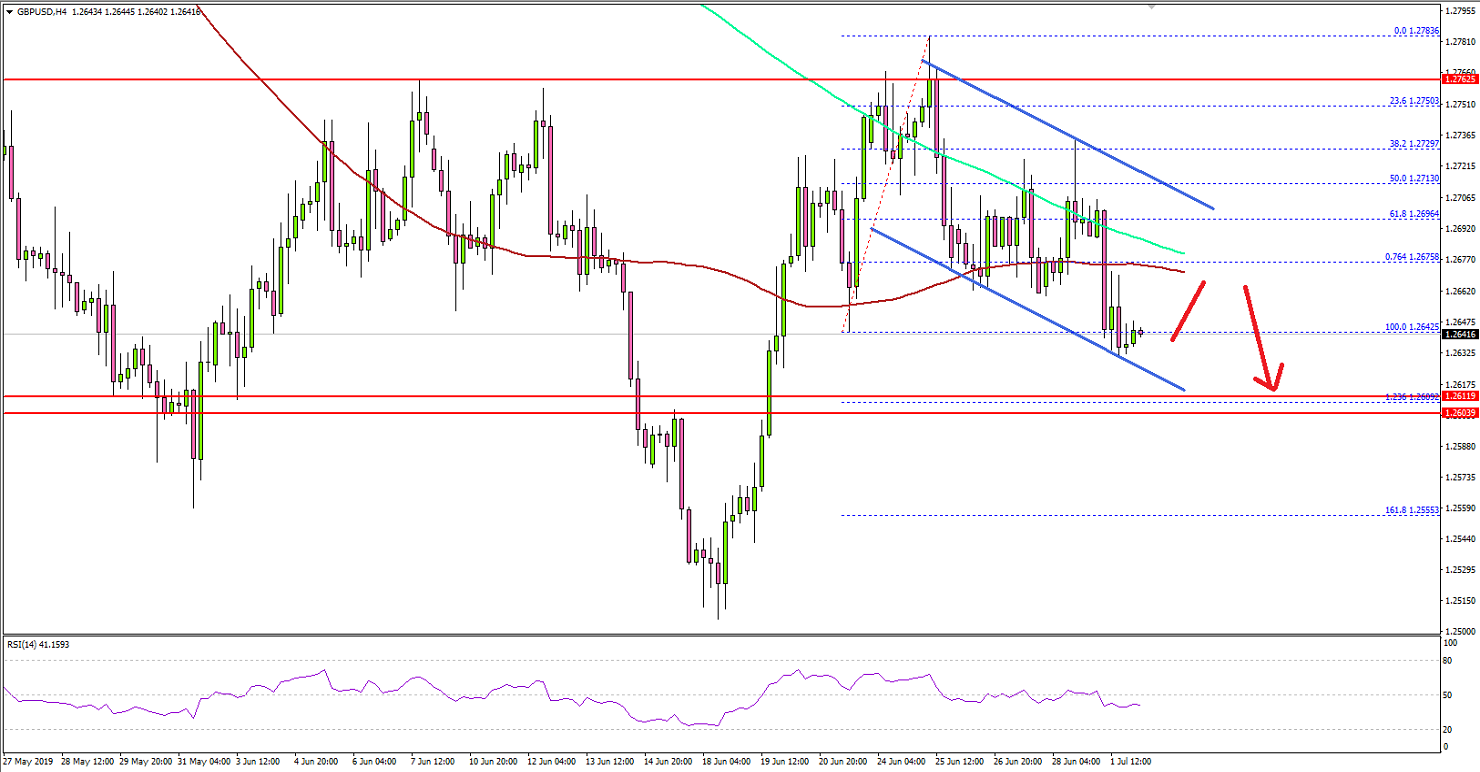
Looking at the 4-hours chart, the pair started a freshdecline from well above the 1.2750. It broke a few important supports near the1.2720 level and the 100 simple moving average (red, 4-hours).
There was also a break below the last swing low near the1.2642. It has opened the doors for more losses below the 1.2640 and 1.2620levels.
The next major support is near the 1.2600 area plus the1.236 Fib extension level of the last wave from the 1.2642 low to 1.2783 high. Oncethe pair revisits the 1.2600 support, it could start a fresh increase above the1.2700 and 1.2720 levels.
On the upside, there are many important resistances near the1.2700 level. There is also a connecting bearish trend line in place withresistance near 1.2695 on the same chart. Therefore, a successful close abovethe 1.2700 barrier is needed for a fresh increase in the near term.
Fundamentally, the UK Manufacturing PMI for May 2019 wasreleased by both the Chartered Institute of Purchasing & Supply and the MarkitEconomics. The market was looking for a minor drop from the last reading of59.4 to 49.2.
The actual result was disappointing, as the UK ManufacturingPMI declined to 48.0 and registered yet another contraction (lowest level sinceFebruary 2013).
The report added:
The UK manufacturing sector continued to feel the reverberations of the unwinding of earlier pre-Brexit stockpiling activity during June. The already high stock levels at both manufacturers and their clients led to a scaling back of output and new order intakes, with demand from both domestic and export markets weakening.
Overall, GBP/USD seems to be struggling to gain bullishmomentum. Therefore, it could slide towards the 1.2600 support before the bullsattempts another upward move.
Economic Releases to Watch Today
- German Retail Sales for May 2019 (MoM) –Forecast 0.5%, versus -2.0% previous.
- UK’s Construction PMI for May 2019 – Forecast 49.3,versus 48.6 previous.
