
Aayush Jindal
Key Highlights
- Gold price rallied above the $1,500 and $1,520resistance levels against the US Dollar.
- A new 6-year high was formed above $1,530 beforethe price corrected lower.
- The US CPI increased 1.8% in July 2019 (YoY),more than the 1.7% forecast.
- The UK CPI might increase 1.9% in July 2019(YoY), less than the last 2.0%.
Gold Price Technical Analysis
This month, gold price gained more than $100 and surged above the $1,480 and $1,500 resistance levels. The price even traded to a new 6-year high above $1,530 and it remains well supported on the downside.
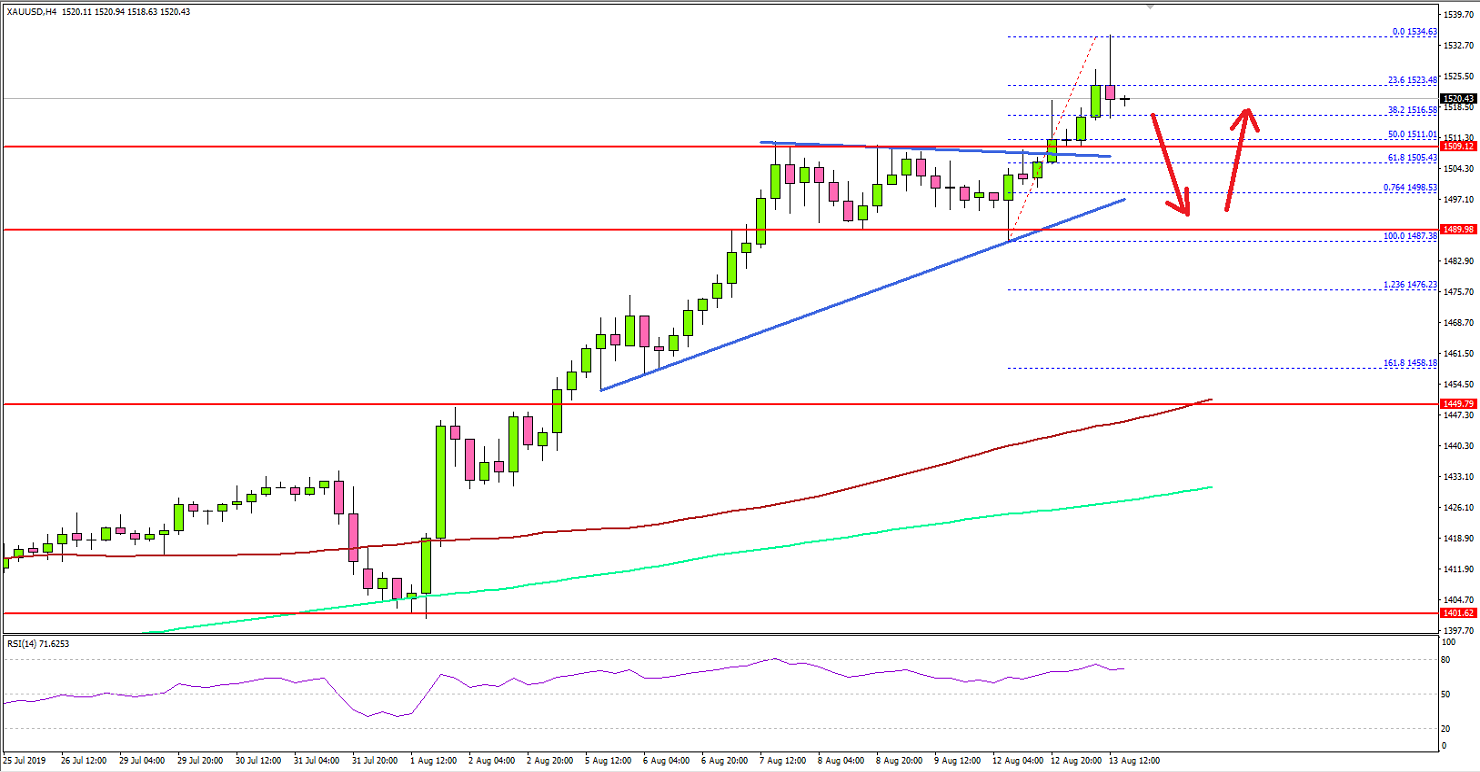
The 4-hours chart of XAU/USD indicates that the price climbedabove the key $1,500 resistance and settled well above the 100 simple movingaverage (4-hours, red).
It opened the doors for more gains and recently the pricesurpassed a bullish continuation pattern with resistance near $1,506. It tradedas high as $1,534 and is currently correcting lower.
On the downside, there are many supports near the $1,510 and$1,500 levels. The previous resistance near $1,510 is likely to act as a strongsupport along with the 50% Fib retracement level of the upward move from the$1,487 low to $1,534 high.
The main support on the downside is near the $1,488 level,below which the price could start a significant downside correction towards the$1,460 and $1,450 support levels.
On the upside, an immediate resistance is near the $1,535level, above which the price could accelerate towards the $1,550 and $1,555levels in the coming days.
Fundamentally, the US Consumer Price Index report for July2019 was released by the US Bureau of Labor Statistics. The market was lookingfor a 0.3% rise in the CPI compared with the previous month.
The actual result was similar to the forecast, as the US CPI increased 0.4%. However, the yearly change exceeded the forecast, with an increase of 1.8% (more than the last 1.6% and better than the 1.7% forecast).
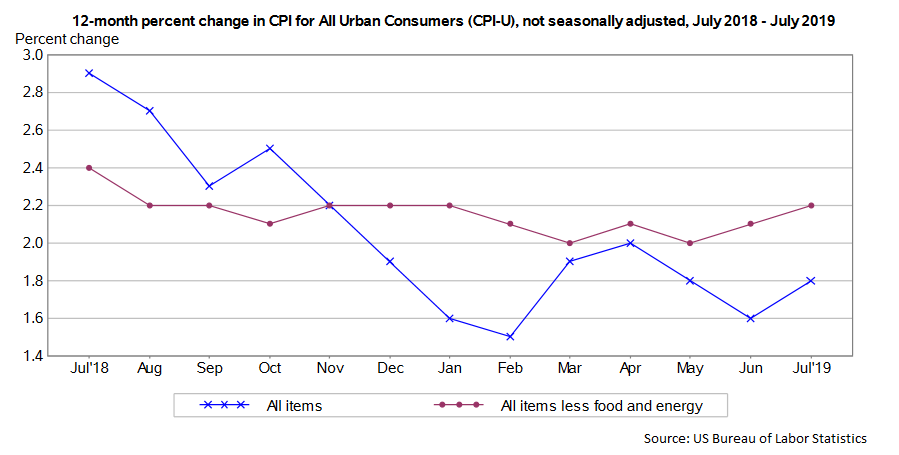
The report added:
The index for all items less food and energy rose 0.3 in July, the same increase as in June. The July rise was broad-based, with increases in the indexes for shelter, medical care, airline fares, household furnishings and operations, apparel, and personal care all contributing to the increase.
Overall, gold price remains in a strong downtrend and remains supported on dips near $1,510 and $1,500. Looking at EUR/USD, the pair is showing positive signs, while GBP/USD is still trading in a bearish zone below 1.2200.
Economic Releases to Watch Today
- Germany’s GDP Q2 2019 (QoQ) (Preliminary) –Forecast -0.1%, versus 0.4% previous.
- UK Consumer Price Index July 2019 (YoY) –Forecast +1.9%, versus +2.0% previous.
- UK Core Consumer Price Index July 2019 (YoY) –Forecast +1.8%, versus +1.8% previous.
- Euro Zone GDP Q2 2019 (Preliminary) (QoQ) -Forecast 0.2%, versus 0.2% previous.
