
Aayush Jindal
Key Highlights
- The US Dollar declined heavily after it brokethe 108.60 support against the Japanese Yen.
- A short term bearish trend line is forming withresistance near 106.40 on the 4-hours chart of USD/JPY.
- The US Initial Jobless Claims in the week endingAugust 03, 2019 declined from 217K to 209K.
- The US PPI in July 2019 might increase 0.2%(MoM), more than the last +0.1%.
USDJPY Technical Analysis
Earlier this month, the US Dollar topped near 109.30 and declined heavily below the 108.60 support against the Japanese Yen. The USD/JPY pair even broke the 107.20 support to enter a bearish zone.
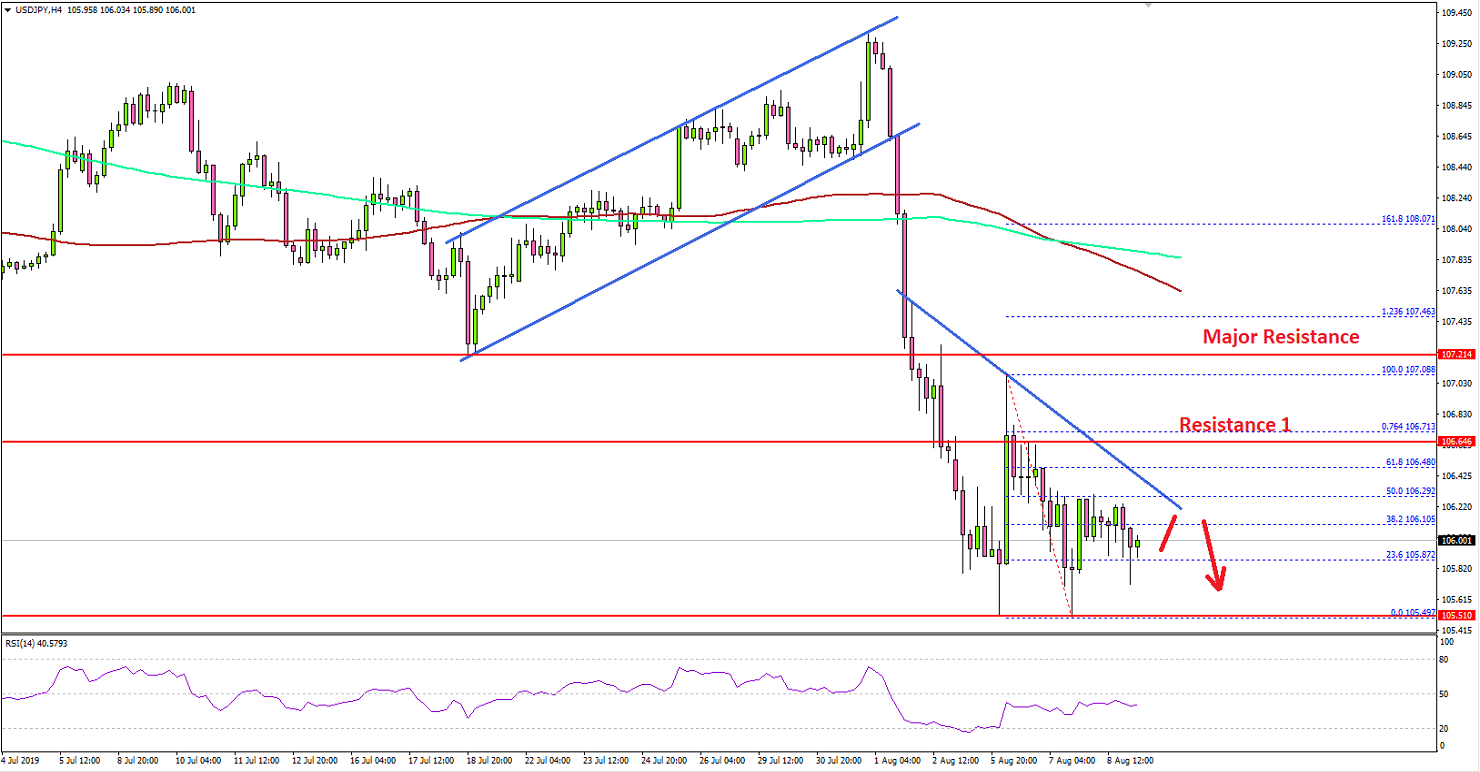
Looking at the 4-hours chart, the pair started a significantdecline after it broke an ascending channel with support near 108.60. As aresult, the pair traded below many important supports in the past few days,including 108.40, 108.00, 107.20, 106.60 and 106.20.
The pair traded to a new monthly low at 105.49 and settledwell below the 100 simple moving average (red, 4-hours). Recently, the pairstarted an upside correction above the 106.00 level plus the 23.6% Fibretracement level of the downward move from the 107.08 high to 105.49 low.
On the upside, the pair might struggle to surpass the 106.50resistance and a short term bearish trend with resistance near 106.40 on thesame chart.
If there is an upside break above 106.40 and 106.50, thepair could recover towards the next important hurdles near 107.00 and 107.20.Conversely, if the pair fails to recover above 106.50, there could be anotherdrop.
On the downside, the main support is near the 105.50 level,below which there is a risk of additional losses towards the 105.10 and 104.85support levels.
Fundamentally, the US Initial Jobless Claims figure for the weekending August 03, 2019 was released by the US Department of Labor. The marketwas looking for no change in claims from 215K.
The actual result was better than the forecast, as there wasa decline in the US Initial Jobless Claims to 209K. The last reading wasrevised up from 215K to 217K.
The report added that:
The 4-week moving average was 212,250, an increase of 250 from the previous week's revised average. The previous week's average was revised up by 500 from 211,500 to 212,000.
Overall, USD/JPY is clearly trading in a crucial downtrend below 107.20. Looking at GBP/USD, the pair is struggling below 1.2200, while EUR/USD is consolidating above the 1.1150 level.
Economic Releases to Watch Today
- UK GDP for Q2 2019 (QoQ) (Prelim) - Forecast 0%,versus +0.5% previous.
- UK Industrial Production for June 2019 (MoM) -Forecast -0.2%, versus +1.4% previous.
- UK Manufacturing Production for June 2019 (MoM)- Forecast -0.1%, versus +1.4% previous.
- US Producer Price Index July 2019 (MoM) –Forecast +0.2%, versus +0.1% previous.
- US Producer Price Index July 2019 (YoY) –Forecast +1.7%, versus +1.7% previous.
- Canada’s Net Change In employment July 2019 –Forecast 12.5K, versus -2.2K previous.
- Canada’s Unemployment Rate July 2019 - Forecast 5.5%,versus 5.5% previous.
