
Aayush Jindal
Key Highlights
- The US Dollar failed to move higher above 107.00 and declined against the Japanese Yen.
- There is a crucial bearish trend line forming with current resistance at 106.80 on the 4-hours chart of USD/JPY.
- The US initial jobless claims for the week ending March 10, 2018 declined from the last revised reading of 230K to 226K.
- Today, the US Industrial Production figure for Feb 2018 will be released, which is forecasted to increase by 0.3% (MoM).
USDJPY Technical Analysis
The US Dollar struggle to move higher above 107.00 continues against the Japanese Yen. The USD/JPY pair is currently trading in a bearish zone with a key support at 105.30.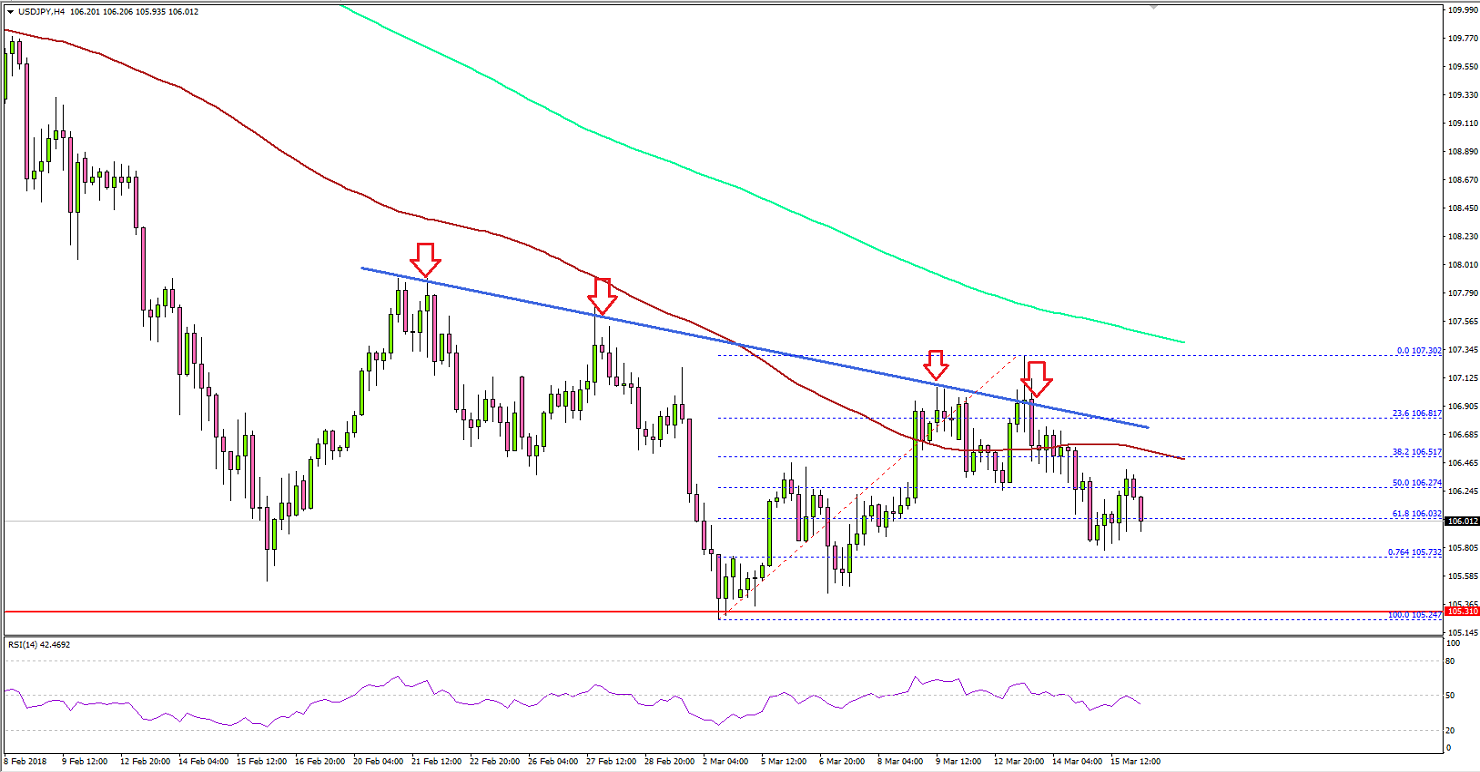 Looking at the 4-hours chart of USD/JPY, the pair failed to gain upside momentum above 107.00. There was a false break above 107.00 and the 100 simple moving average (red, 4-hour).Buyers failed and the pair declined back below 107.00 and the 100 SMA. There was also a move below the 50% Fib retracement level of the last wave from the 105.24 low to 107.30 high.It seems like the pair is under pressure and it may continue to struggle to move above 107.00. Moreover, there is a crucial bearish trend line forming with current resistance at 106.80 on the same chart.A successful close above 107.00 could push the pair back in the bullish zone towards 108.50. On the downside, the last swing low of 105.30 is a major support. A push below 105.30 could expose a move towards 104.00.Recently, the US initial jobless claims report for the week ending March 10, 2018 was released by the US Department of Labor. The market was looking for a decline to 226K, and the outcome was similar.Moreover, the last reading was revised down from 231K to 230K. The report added that:
The 4-week moving average was 221,500, a decrease of 750 from the previous week's revised average. The previous week's average was revised down by 250 from 222,500 to 222,250.
However, the US Dollar failed to gain bids versus the Japanese Yen. On the other hand, there was a slight bearish pressure on EUR/USD and GBP/USD.
Economic Releases to Watch Today
- Euro Zone CPI for Feb 2018 (YoY) - Forecast +1.2%, versus +1.2% previous.
- Euro Zone CPI for Feb 2018 (MoM) - Forecast +0.2%, versus -0.9% previous.
- US Housing Starts for Feb 2018 (MoM) – Forecast 1.280M, versus 1.326M previous.
- US Building Permits for Feb 2018 (MoM) – Forecast 1.320M, versus 1.377M previous.
- US Industrial Production for Feb 2018 (MoM) – Forecast +0.3%, versus -0.1% previous.