
Nick Goold
Markets surged on Monday, May 12, after a breakthrough in US–China trade talks. Both sides agreed to significantly cut tariffs and pause new trade actions for 90 days.
Key outcomes include:
- US tariffs on Chinese goods falling from 145% to 30%
- Chinese tariffs on US goods dropping from 125% to 10%
- China reversing restrictions on key exports
- A small US tariff tied to drug enforcement staying in place
This surprise announcement marked the most constructive step in months and triggered a wave of optimism across global markets. Stocks jumped, risk sentiment improved, and traders began to price in the possibility of a broader deal.

Momentum Builds — But the Next 90 Days Are Critical
Markets are more optimistic after the recent US–China deal. China has stayed firm and calm, while the US has eased some of its toughest tariff demands under pressure. But the agreement is only a pause. Key issues like tech transfers and subsidies remain unresolved, and talks could still break down.
The 90-day window runs through mid-August. A full deal could lift markets further, but any setback may bring tariffs back — and renewed volatility. With ongoing uncertainty and Trump’s unpredictable tone, traders should stay cautious. Volatility may ease but will likely stay high as news continues to drive price swings.
Over the next 90 days, there will likely be many headlines as the US and China continue negotiating — creating plenty of trading opportunities. Ultimately, both countries want a positive outcome, as they’ve seen the damage the trade war has already caused to global markets. Like any major negotiation, the process will take time, and both sides will push hard to secure the best possible deal.
Trading Strategy: Timing and Risk Matter More Than Prediction
With US–China negotiations set to continue over the next 90 days, markets are likely to swing on unexpected headlines. Even if you anticipate the overall direction correctly, sudden shifts in tone or new developments can catch you off guard. You might expect prices to rise, but enter too early or place a stop too close — only to get stopped out by a short-term dip. Or you may hold a winning trade too long, hoping for more, and watch profits disappear as the market reverses. In a news-driven environment like this, trading success comes less from prediction — and more from managing your timing, risk, and exit strategy.
Here’s a clear and practical strategy:
✅ 10-day Simple Moving Average (SMA)
Use the 10-day SMA to stay aligned with the market’s short-term direction.
- Follow the trend when price is moving near the SMA.
- Be cautious when price moves too far above or below the SMA — this often signals a reversal.
- In an uptrend, a move below the SMA can signal a price decline.
- In a downtrend, a move above the SMA may indicate a possible price rise.
✅ Support and Resistance Zones
Support and resistance levels are useful — but dangerous if traded without care.
- Avoid trading too close to these levels. Volatility tends to spike near support or resistance, making it easy to get stopped out.
- Instead, look for a clear break of the level to confirm momentum.
- In high-volatility markets, false breaks can offer strong trade setups — for example, if price dips below support but quickly moves back above, it may signal a high-probability buy. The same logic applies for short trades near resistance.
✅ Risk Management Is Your Real Edge
- Size positions correctly to avoid large drawdowns.
- Set your stop loss below support when buying and above resistance when selling.
- Have a plan to take profits, especially when price approaches key levels or volatility spikes.
Even if you're right about the market direction, you can still lose by entering at the wrong time or not managing risk. Good traders don’t try to guess every move — they focus on timing, managing losses, and maximizing profits.
What Baseball Can Teach You About Trading — And 3 Tools to Help You Trade Smarter
Baseball and trading have a lot in common. In baseball, a 40% on-base rate is excellent — and in trading, a 40% win rate can also lead to large long-term profits if losses are small and winners are bigger. But many traders wrongly think they need a 70–80% win rate, which often leads to stress and large losses from holding onto losing trades too long. The best traders focus on strategy, timing, and risk control — not perfection. Here are three common trading problems, and how Titan FX tools can help you trade smarter.
Problem 1: Thinking You Need to Win Every Trade
One of the biggest mistakes traders make is thinking that winning most of their trades is the only path to profitability. In reality, many professional traders win less than half the time — but they stay consistently profitable by keeping losses small and letting winners run.
Solution: Monthly Profitable Customer Ratio
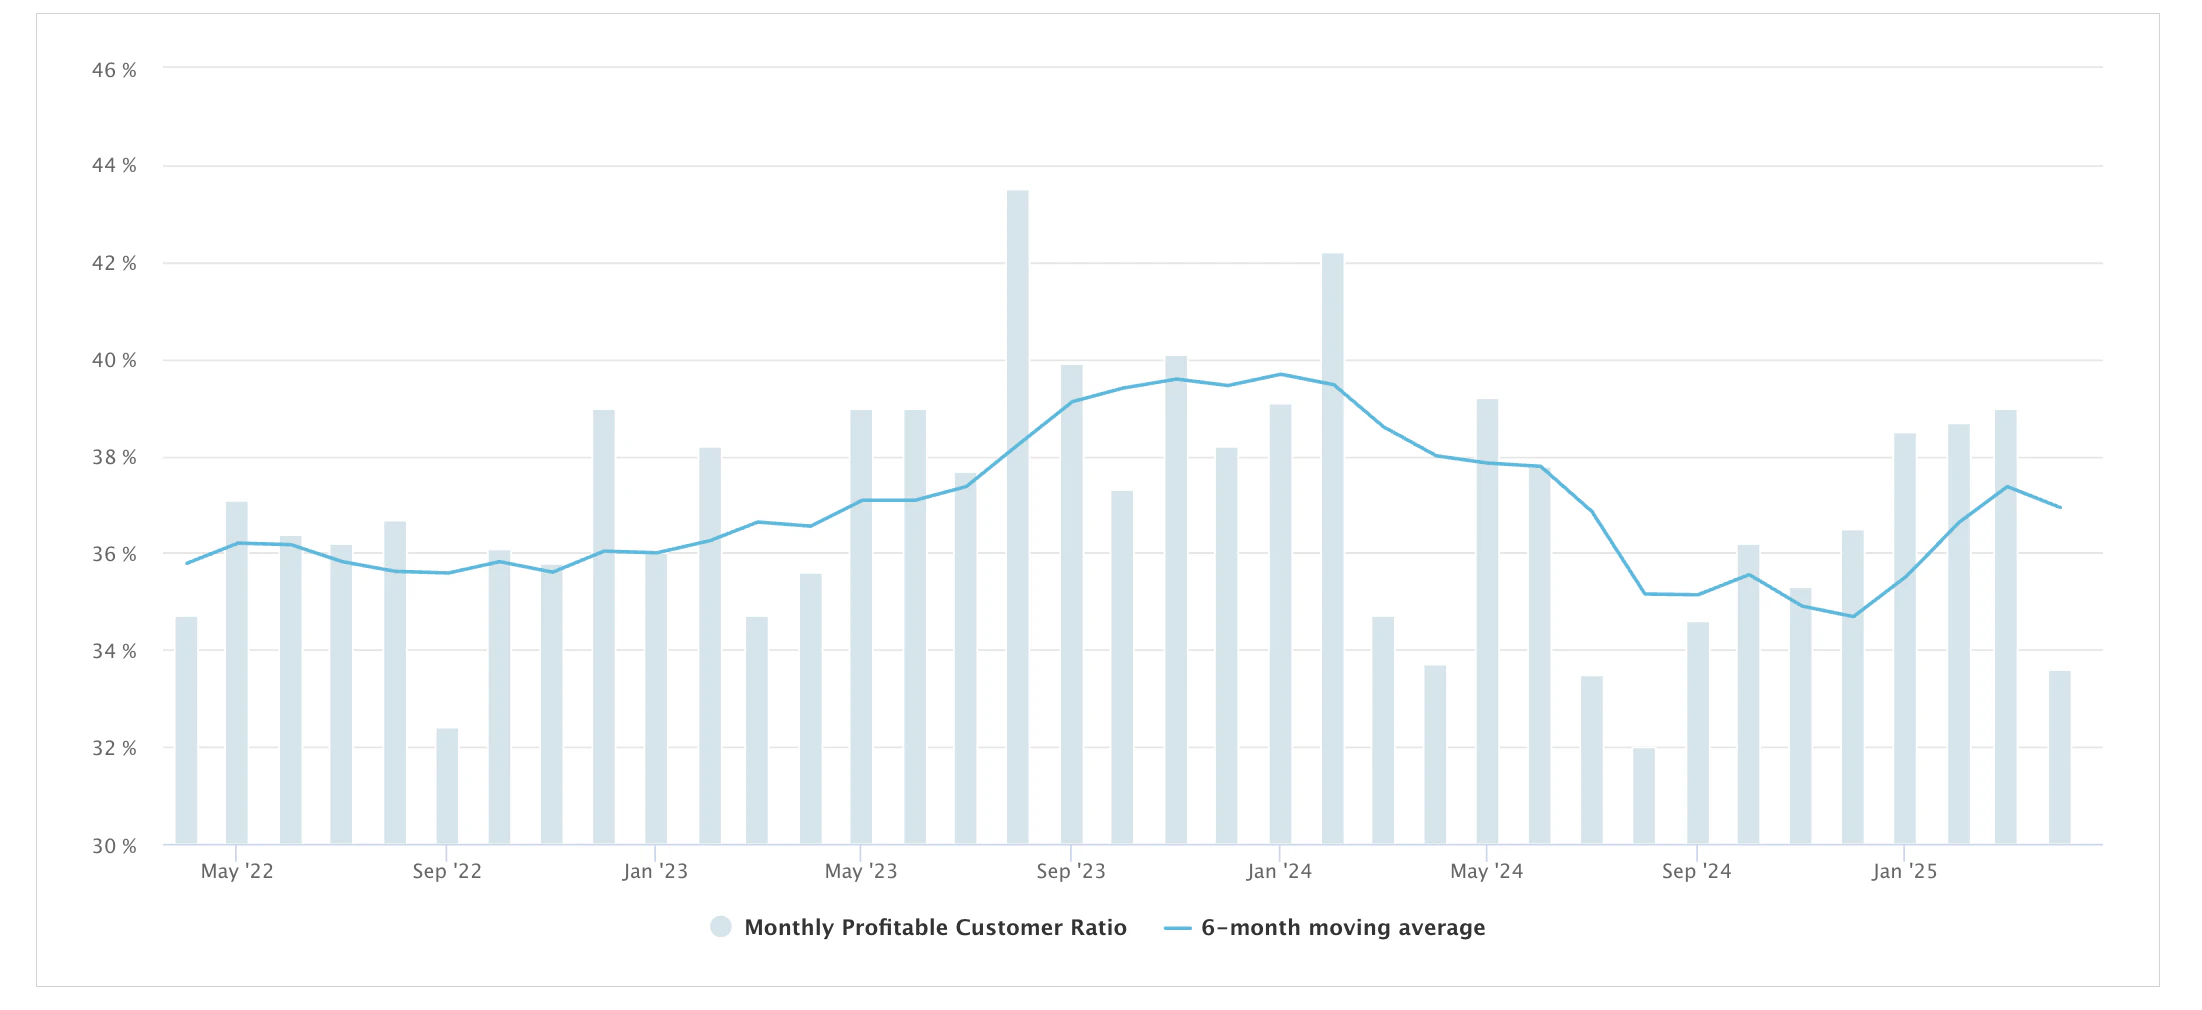
Monthly Profitable Customer Ratio
This tool shows how many Titan FX traders were profitable each month, based on the percentage whose account balances grew. Over the past six months, the average has been 36.9%. Rather than aiming to win every trade, this tool helps shift your focus toward smarter risk management — which is what separates long-term success from short-term luck.
You can view the Monthly Profitable Customer Ratio here.
Problem 2: Not Knowing Which Market to Trade
With so many choices — forex, commodities, indices, crypto, and individual U.S. and Japanese stocks — it’s easy to feel overwhelmed. Trading a quiet, range-bound market makes it hard to find profitable opportunities. Profitable trades are easier to spot when the market is already moving.
Solution: Price Movement Ranking
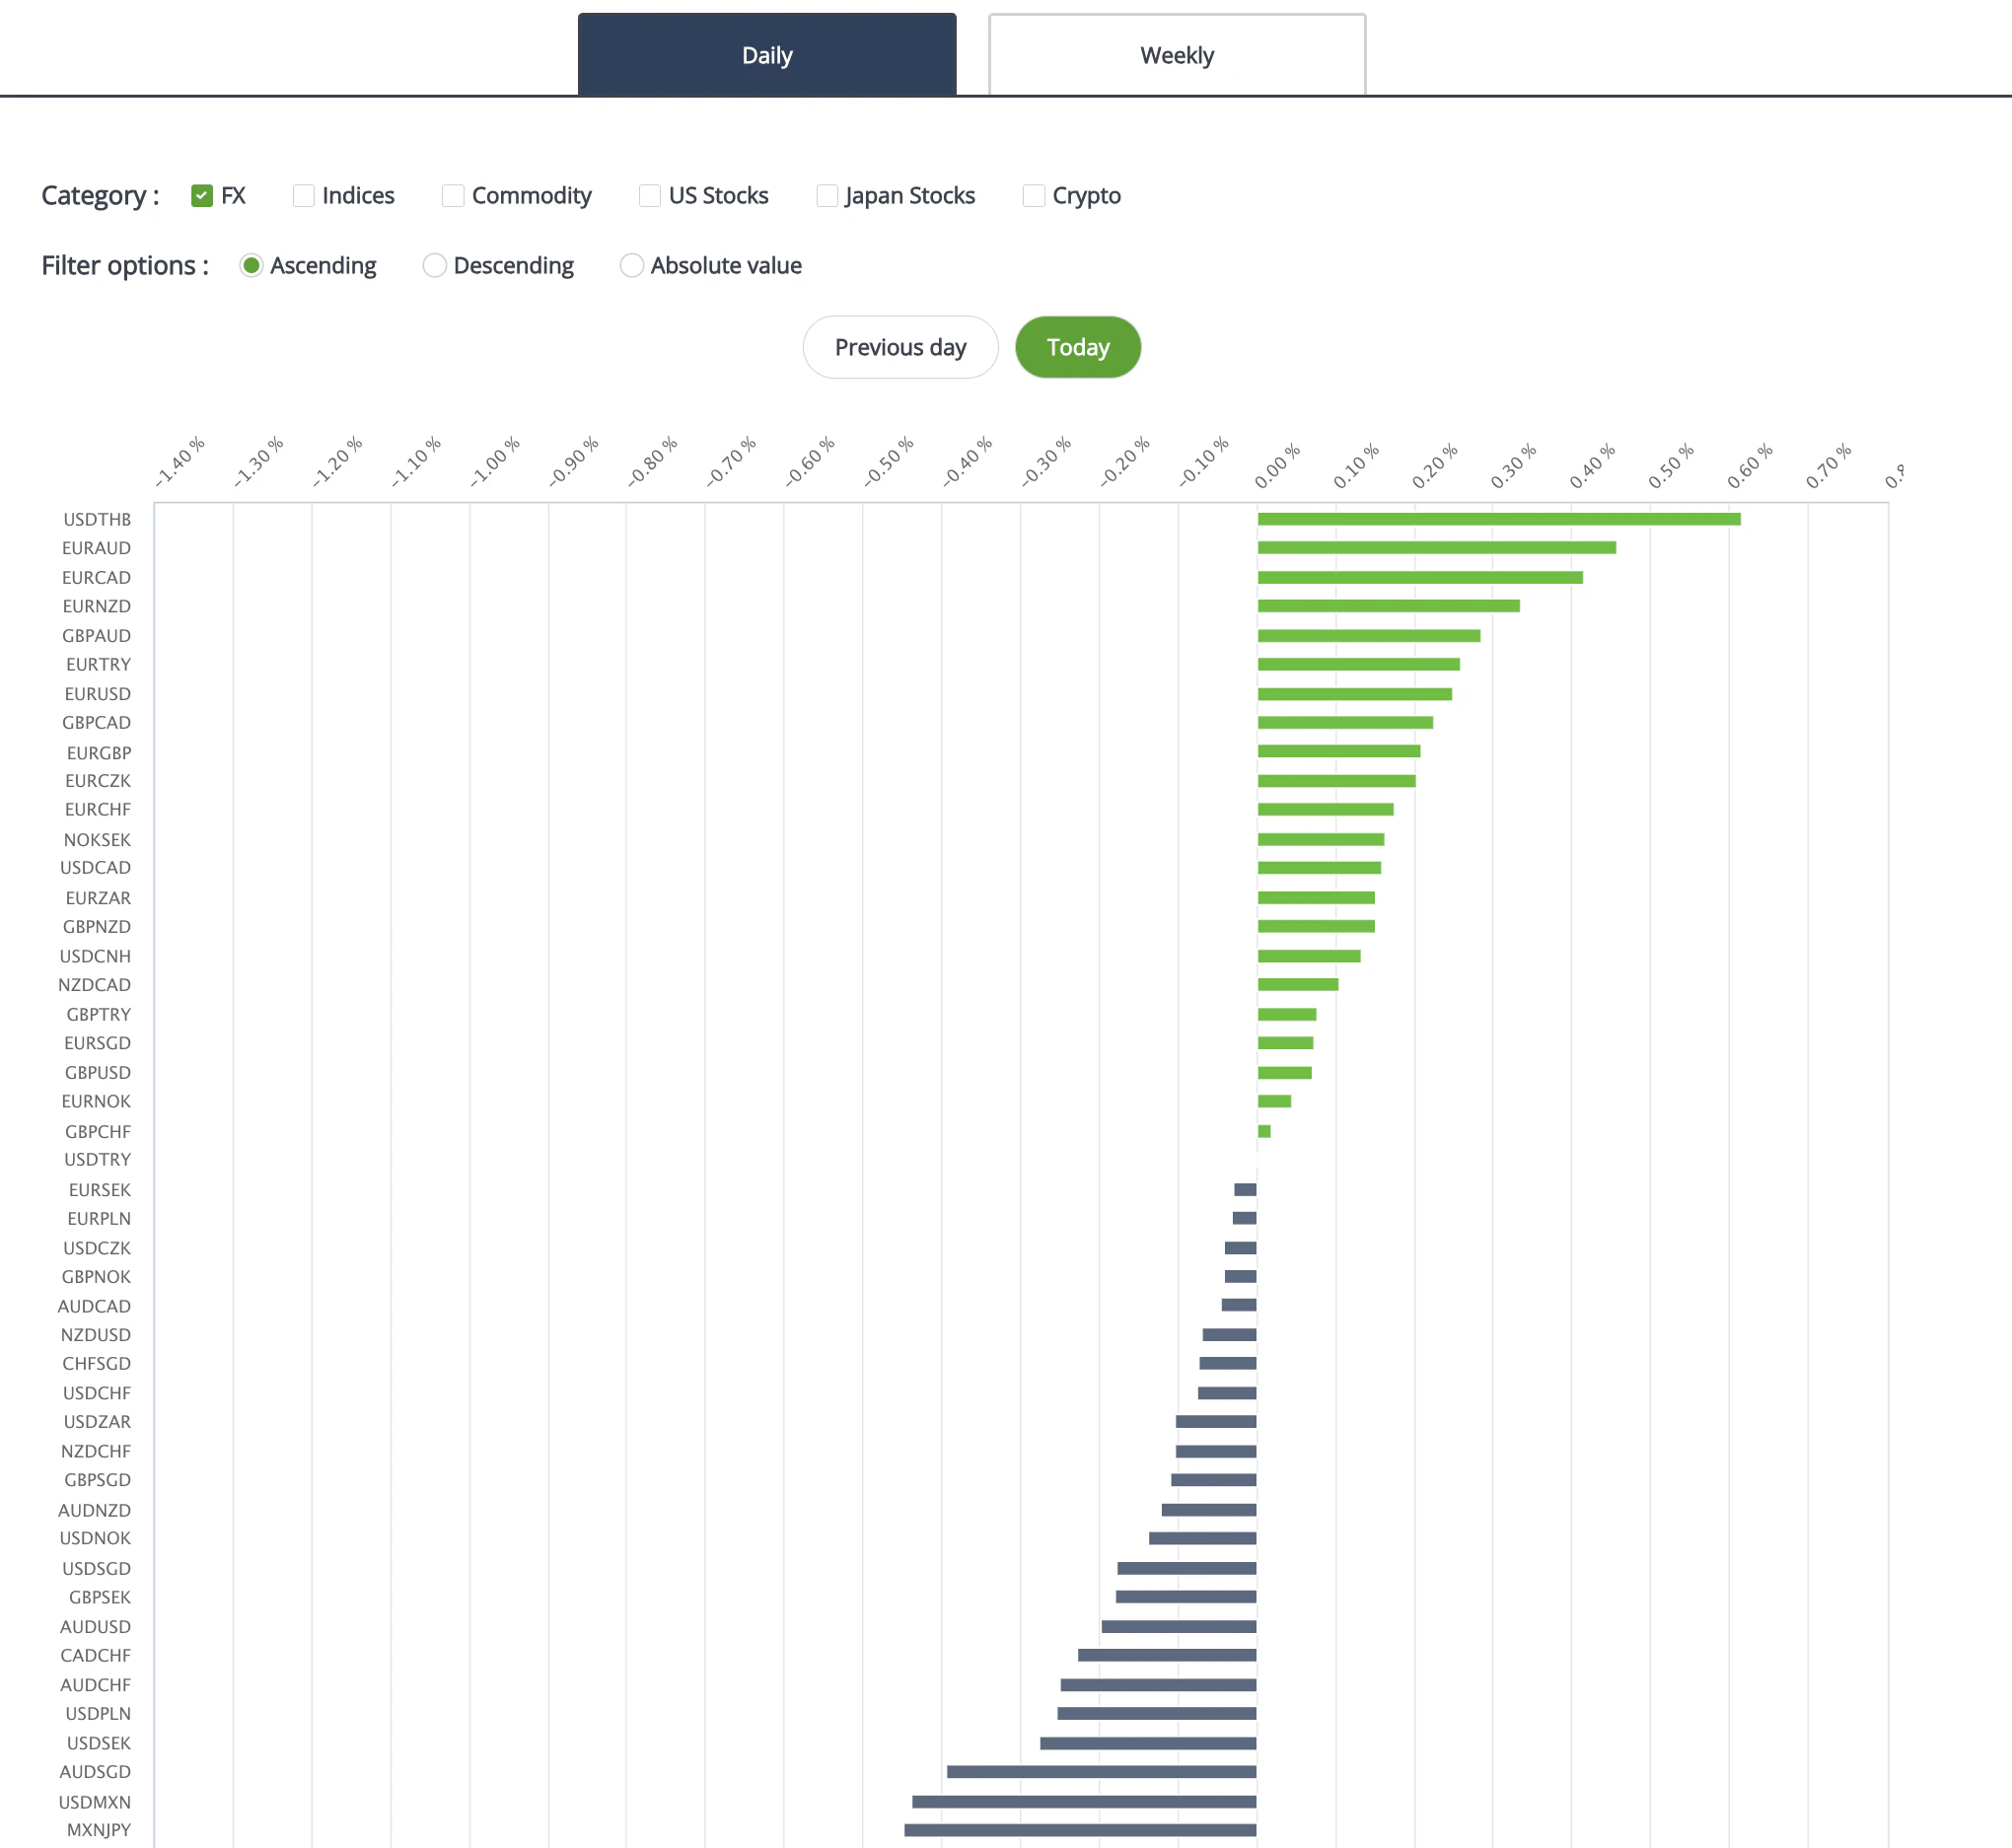
Price Movement Ranking
This tool shows which markets had the biggest price movements over the past day and week. It highlights the most active instruments across all asset classes, helping you focus on where momentum is strong — so you can find profitable trend-following or trend-reversal trading opportunities.
You can view the Price Movement Ranking here.
Problem 3: Guessing What Other Traders Are Doing
Understanding what other traders are doing — and where their orders are — can give you an important edge. If 60% of traders are buying, the trend may continue. But if 85% are buying, the market could be overcrowded and ready to reverse. Without this kind of insight, you’re left guessing — and that often leads to losses.
Solution: Pending Orders and Open Position Trends

Pending Orders and Open Position Trends
This tool gives you a visual snapshot of where traders have placed orders and what positions they currently hold — including for major pairs and popular stocks. It helps you spot where buying or selling pressure is building, making it easier to identify breakout points, support and resistance zones, or possible reversals.
You can view the Pending Orders and Open Position Trends here
Just like in baseball, trading success isn’t about hitting every pitch — it’s about waiting for the right one. These tools can help you stay focused, manage risk better, and trade with more clarity in any market.
Ready to Start?
You can access these powerful new tools — and many others — directly through the Titan FX Research Hub. In addition to indicators, you’ll find market insights, research articles, and educational resources designed to help you trade smarter every day.
🔗 Visit here: https://research.titanfx.com/
Explore the full potential of Titan FX Research — and make volatility your greatest ally.