
Aayush Jindal
Key Highlights
- Bitcoin rallied above the $115,000 resistance zone before a consolidation phase.
- BTC/USD is following a declining channel with support at $113,500 on the 4-hour chart.
- Ethereum climbed higher above $3,800 resistance.
- XRP price rallied above the $3.20 level and recently corrected gains.
Bitcoin Price Technical Analysis
Bitcoin price started a fresh increase above the $115,000 zone against the US Dollar. BTC was able to climb above the $118,000 and $120,000 resistance levels.
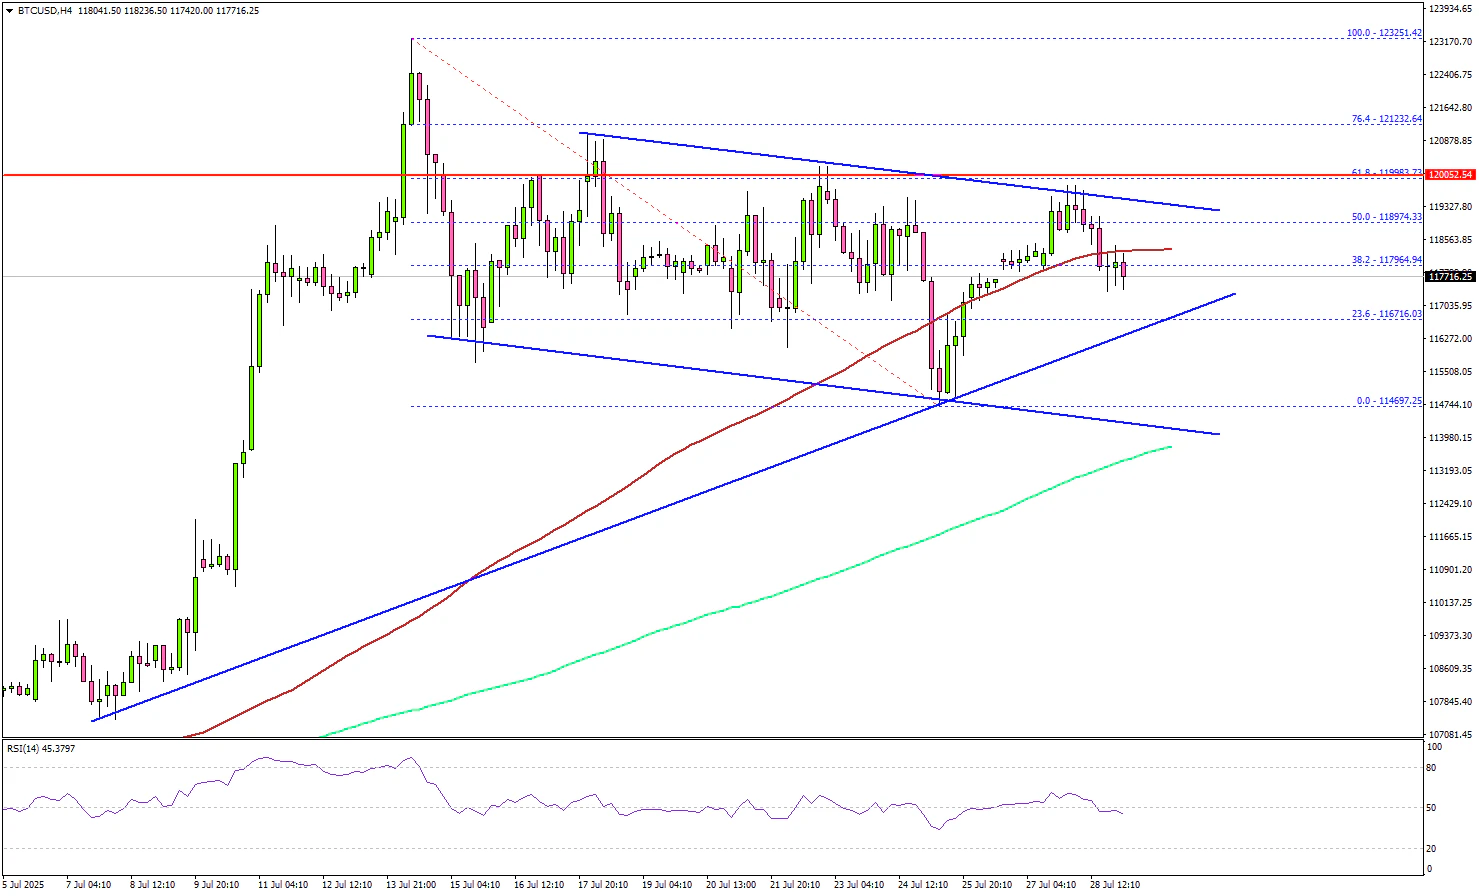
Looking at the 4-hour chart, the price settled above the $115,000 level, the 100 simple moving average (red, 4-hour), and the 200 simple moving average (green, 4-hour). The bulls even pumped the price above the $122,000 resistance.
A new all-time high was formed near $123,200 and the price is now correcting gains. Immediate support is near $116,700 and a connecting bullish trend line on the same chart.
A downside break below $116,700 might send BTC toward the $115,000 support. Any more losses might send the price toward the $113,500 support zone. There is also a declining channel in place with support at $113,500.
On the upside, the price could face resistance near the $119,500 level. The next key resistance is $120,500. A successful close above $120,500 might start another steady increase.
In the stated case, the price may perhaps rise toward the $122,500 level. Any more gains might call for a test of $123,200.
Looking at Ethereum, the bulls seem to be in control, and they were able to push the price above the $3,800 resistance zone.
Today’s Economic Releases
- US Housing Price Index for May 2025 (MoM) - Forecast -0.2%, versus -0.4% previous.
