
Aayush Jindal
Key Highlights
- Bitcoin price is struggling to recover above the $60,000 resistance.
- BTC is trading below a key bearish trend line with resistance at $59,400 on the 4-hour chart.
- Oil prices extended losses and traded below $72.50.
- Gold might correct gains and retest the $2,450 support.
Bitcoin Price Technical Analysis
Bitcoin price started a recovery wave from the $57,000 zone. BTC/USD climbed above the $58,500 resistance but the upsides were limited.
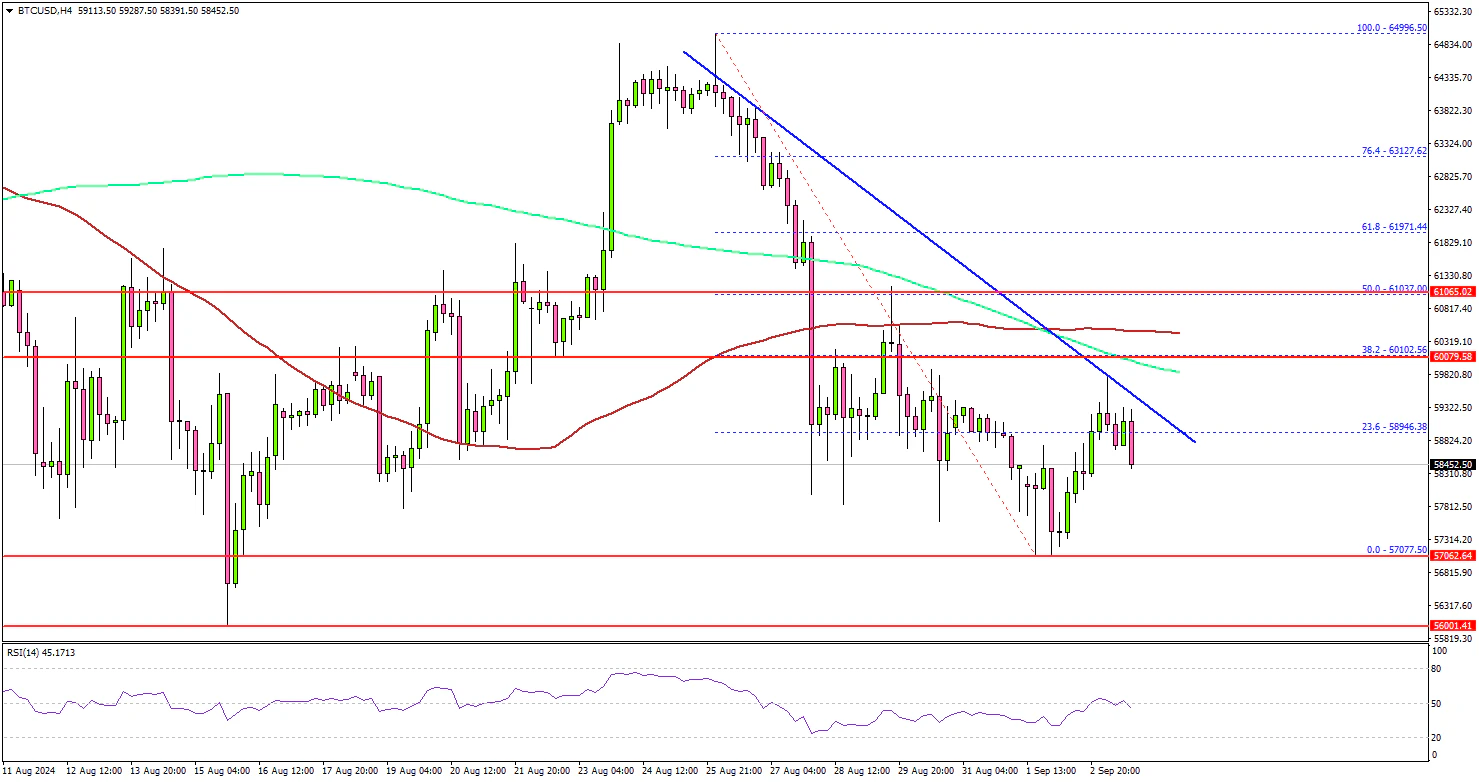
Looking at the 4-hour chart, the price failed to settle above the 23.6% Fib retracement level of the downward move from the $64,996 swing high to the $57,077 low. BTC is also trading below a key bearish trend line with resistance at $59,400.
The main resistance seems to be forming near the $60,000 zone and the 200 simple moving average (green, 4 hours). It is close to the 50% Fib retracement level of the downward move from the $64,996 swing high to the $57,077 low.
A clear move above the trend line and then $60,000 might send the price toward the 100 simple moving average (red, 4 hours) at $60,500.
A successful close above $60,500 might start another steady increase. In the stated case, the price may perhaps rise toward the $62,000 level.
Immediate support is near the $57,250 level. The next key support sits at $56,500. A downside break below $56,500 might send Bitcoin toward the $55,000 support. Any more losses might send the price toward the $52,500 support zone.
Looking at gold, the price is showing a few bearish signs and it might correct gains to test the $2,450 support zone.
Today’s Economic Releases
- US Factory Orders for July 2024 (MoM) - Forecast +4.6%, versus -3.3% previous.
- Fed's Beige Book.
