
Aayush Jindal
Key Highlights
- Bitcoin price is consolidating above the $23,000 support zone.
- BTC broke a major bearish trend line at $23,500 on the 4-hours chart.
- Gold price climbed higher above the $1,830 resistance zone.
- EUR/USD extended its recovery above the 1.0640 resistance zone.
Bitcoin Price Technical Analysis
Bitcoin price found support near the $22,800 zone after a major decline. BTC/USD traded as low as $22,823 and recently started an upside correction.
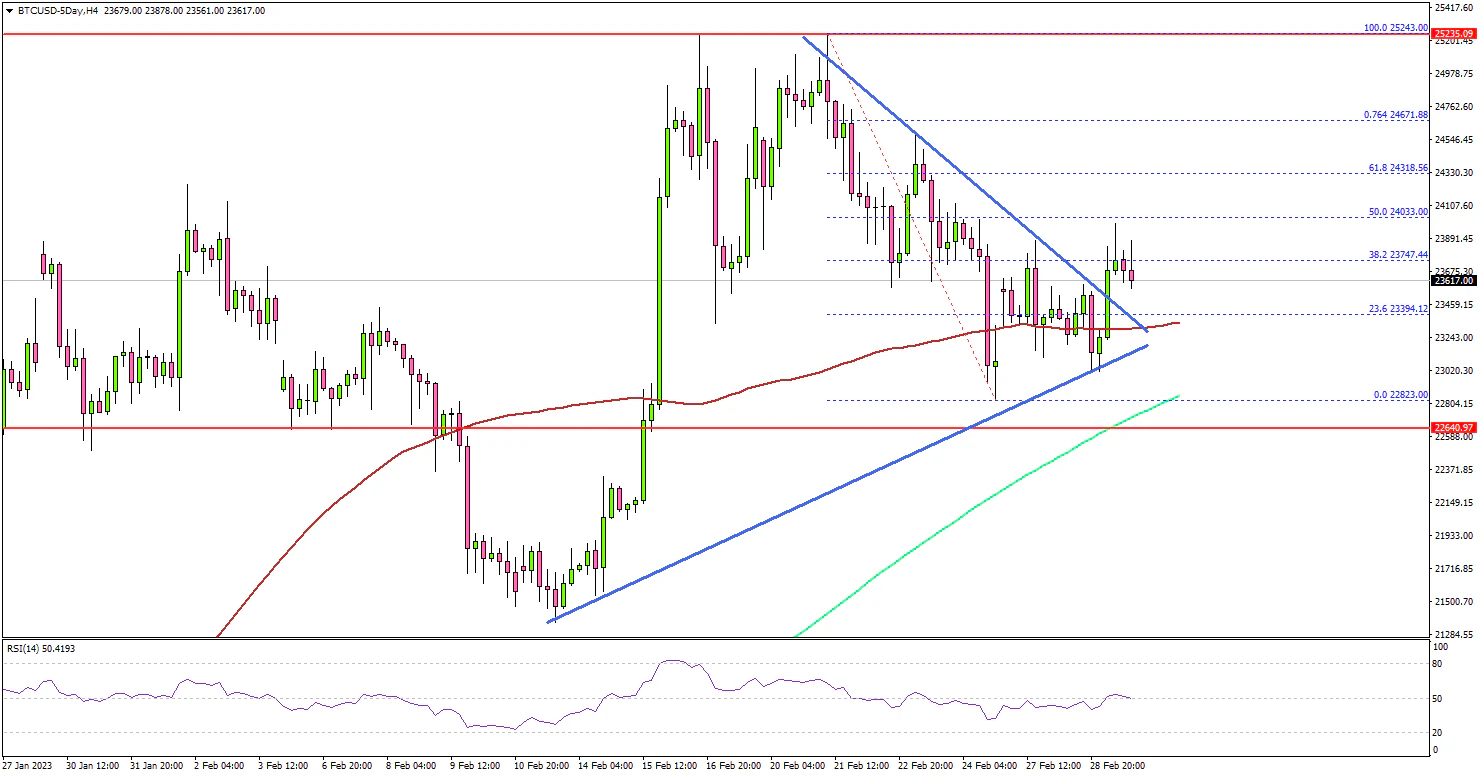
Looking at the 4-hours chart, the price climbed higher above the $23,400 resistance zone. Besides, there was a break above a major bearish trend line with resistance at $23,500 on the 4-hours chart.
There was a break above the 23.6% Fib retracement level of the downward move from the $25,243 swing high to $22,823 low. On the upside, the price is facing resistance near the $24,050 resistance zone.
The 50% Fib retracement level of the downward move from the $25,243 swing high to $22,823 low is also near the $24,050 level. A close above the $24,050 level may perhaps start another steady increase in the coming sessions.
In the stated case, the price could rise towards the $24,650 level. Any more gains could set the pace for a move towards the $25,000 level.
On the downside, the price is stable above the 100 simple moving average (red, 4-hours), and the 200 simple moving average (green, 4-hours). An initial support sits near the $23,400 level. The main breakdown support sits near the $22,850 zone.
If there is a downside break and close below $22,850, bitcoin might start another decline in the coming days. In the stated case, it could revisit the $22,200 support or even test $21,500.
Economic Releases
- Eurozone Consumer Price Index for Feb 2023 (YoY) – Forecast +8.2%, versus +8.6% previous.
- Eurozone Consumer Price Index for Feb 2023 (MoM) – Forecast -0.3%, versus -0.2% previous.
- US Initial Jobless Claims - Forecast 197K, versus 192K previous.
