
Aayush Jindal
Key Highlights
- Bitcoin started a recovery wave above $112,000 after a major crash.
- BTC/USD is still below a key bearish trend line with resistance at $117,800 on the 4-hour chart.
- Ethereum also started a decent increase above $4,000.
- XRP price is back above $2.20 but faces hurdles near $2.650.
Bitcoin Price Technical Analysis
Bitcoin price started a major decline below $115,000 against the US Dollar. BTC dived below $112,000 and $110,000 before the bulls took a stand.
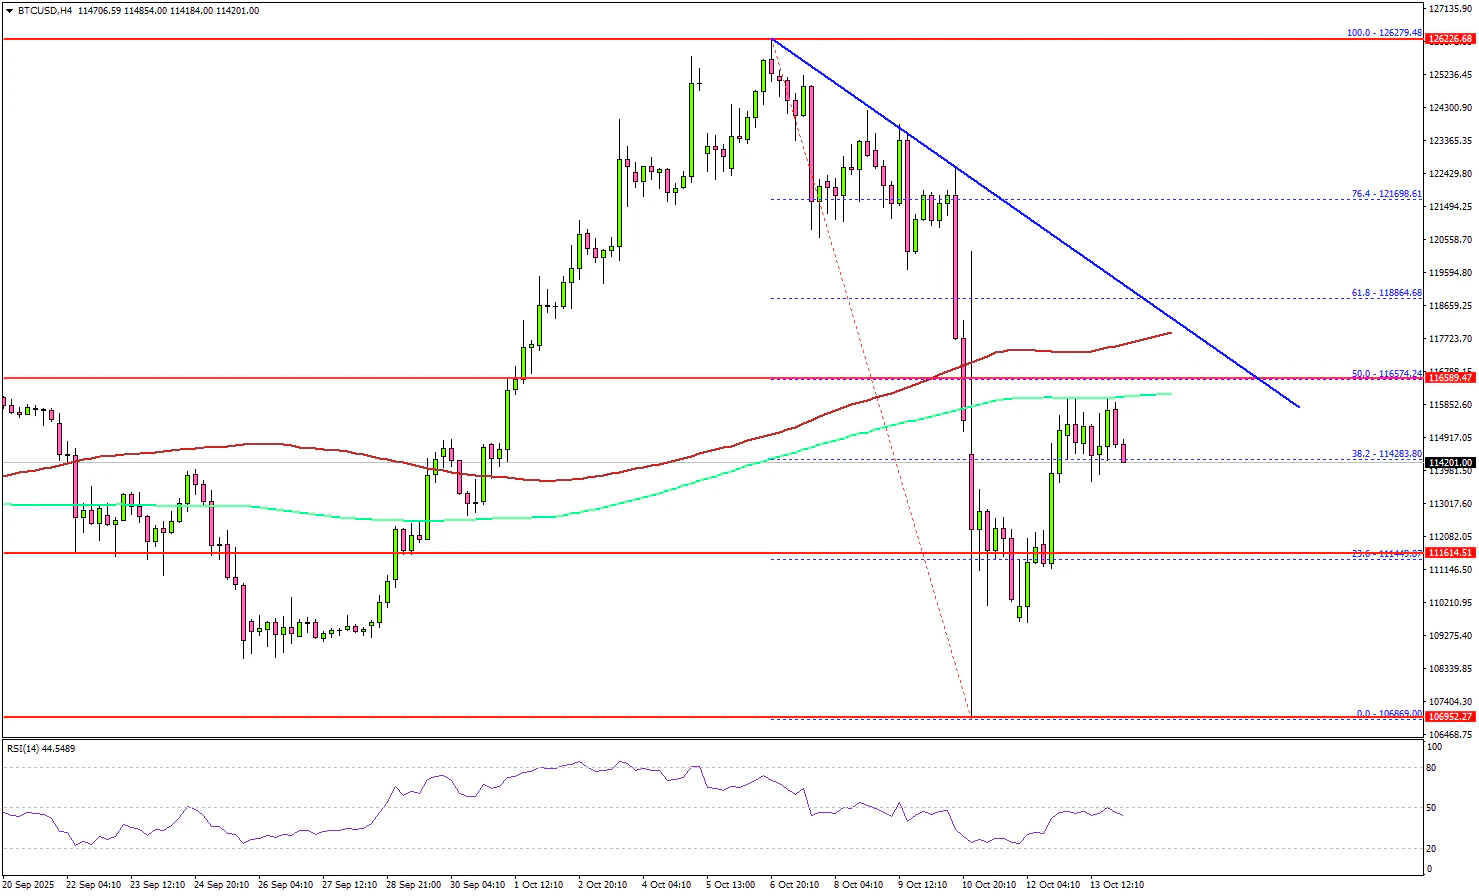
Looking at the 4-hour chart, the price traded as low as $106,869 on TitanFX and recently started a steady recovery wave. The price climbed above the $112,000 resistance zone. There was a move above the 38.2% Fib retracement level of the downward move from the $126,279 swing high to the $106,869 low.
However, the price is still below the 100 simple moving average (red, 4-hour) and the 200 simple moving average (green, 4-hour). There is also a key bearish trend line forming with resistance at $117,800.
Immediate support sits at $112,500. A downside break below $112,500 might start another decline. The next major support is $111,600. Any more losses might call for an extended decline toward the $108,000 support zone.
On the upside, the price now faces resistance near the $116,000 level and the 200 simple moving average (green, 4-hour). The main hurdle is now forming near $117,500. A successful close above $117,500 might start another steady increase. In the stated case, the price may perhaps rise toward the $118,800 level. Any more gains might call for a test of $120,000.
Looking at Ethereum, the price was able to follow Bitcoin and climbed above the $4,000 resistance region.
Today’s Key Economic Releases
- Fed's Chair Powell speech.
- BoE's Governor Bailey speech.
