
Aayush Jindal
Key Highlights
- Bitcoin started a recovery wave above $112,000 and $113,000.
- BTC/USD is now following a rising channel with resistance at $115,500 on the 4-hour chart.
- Ethereum is showing signs of a fresh increase and is stable above $4,300.
- XRP price is up over 5% and might soon attempt to clear $3.120.
Bitcoin Price Technical Analysis
Bitcoin price found support near $107,250 against the US Dollar. BTC started a recovery wave and climbed above the $112,000 resistance.
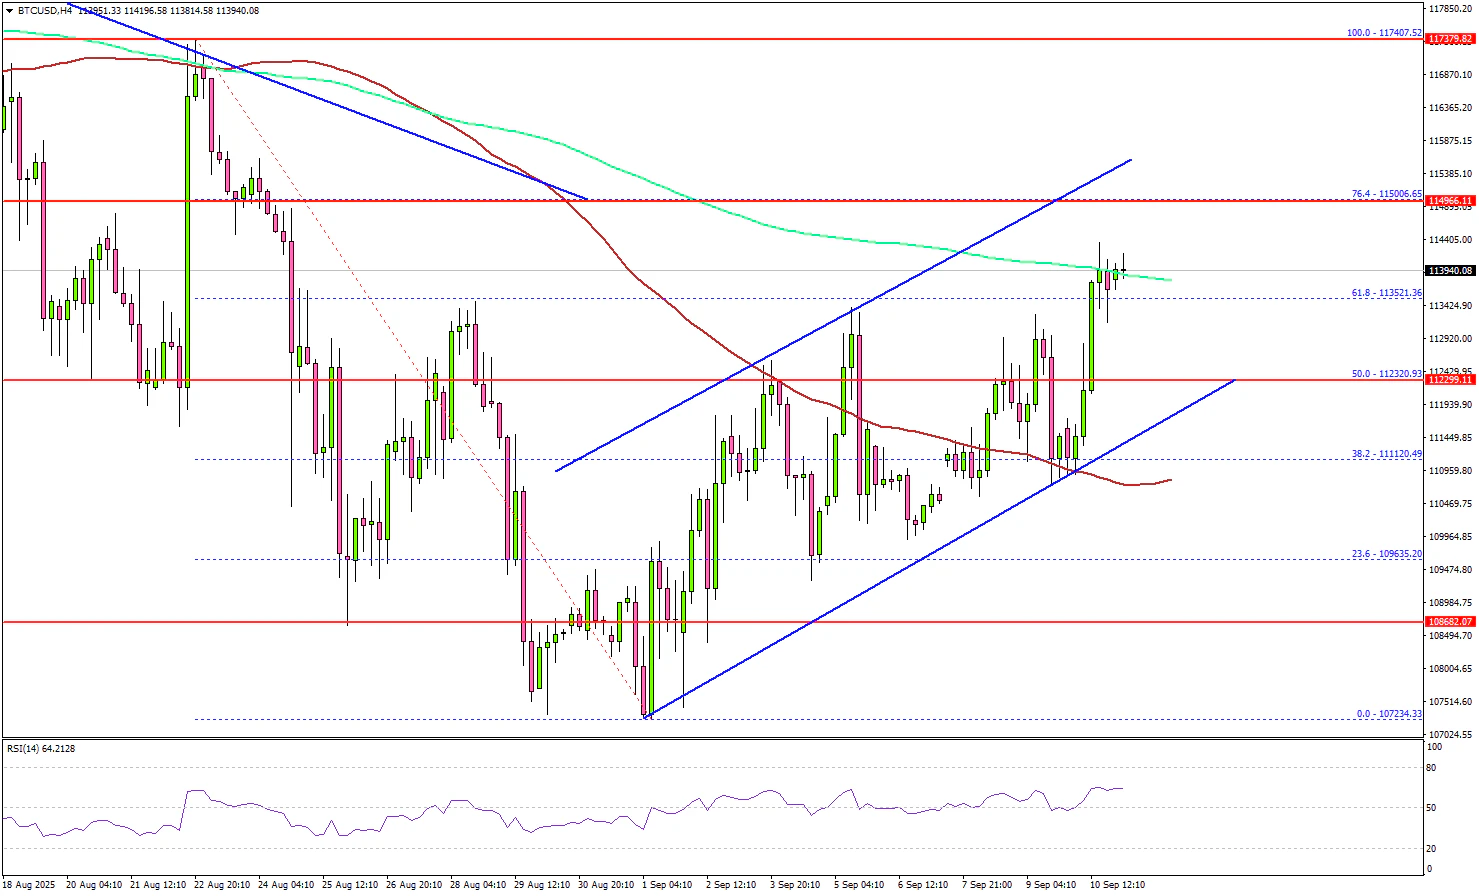
Looking at the 4-hour chart, the price was able to settle above the $112,000 level and the 100 simple moving average (red, 4-hour). There was a move above the 50% Fib retracement level of the downward move from the $117,407 swing high to the $107,234 low.
On the upside, the price now faces resistance near the $115,000 level and the 76.4% Fib retracement. The next key resistance is $115,500. There is also a rising channel forming with resistance at $115,500.
The main hurdle is now forming near $116,000. A successful close above $116,000 might start another steady increase. In the stated case, the price may perhaps rise toward the $118,000 level. Any more gains might call for a test of $120,000.
Immediate support is $112,500. A downside break below $112,500 might send BTC toward the $118,800 support. Any more losses might send the price toward the $110,000 support zone.
Looking at Ethereum, the price seems to be forming a base above $4,300 and might soon aim for a move above $4,600.
Today’s Key Economic Releases
- US Consumer Price Index for August 2025 (MoM) – Forecast +0.3%, versus +0.2% previous.
- US Consumer Price Index for August 2025 (YoY) – Forecast +2.9%, versus +2.7% previous.
- US Initial Jobless Claims - Forecast 235K, versus 237K previous.
