Nick Goold
The bullish flag pattern is a bullish price action pattern used by both short-term and long-term traders. A bullish flag trading pattern forms when the price of an asset rises sharply and then consolidates before continuing higher. The consolidation period results in lower volatility and the market moving sideways to lower. A break of the upper trend line signals a buy entry completing the bullish flag pattern.
This pattern usually means that the market is very bullish, potentially because of new information and that the asset will likely go up shortly. Traders will exit losing short positions should the uptrend channel line be broken, along with new buy entry orders from other traders.
The sharp upward price movement is known as the "flagpole," indicating strong buying pressure. The consolidation phase represents a temporary pause in demand as traders take profits.
The flagpole is one of the key features of a bullish flag pattern. This flagpole should be steep and pointed, indicating sudden buying pressure. Typically, the flagpole is preceded by an accumulation phase in which the price rises steadily with little volatility.
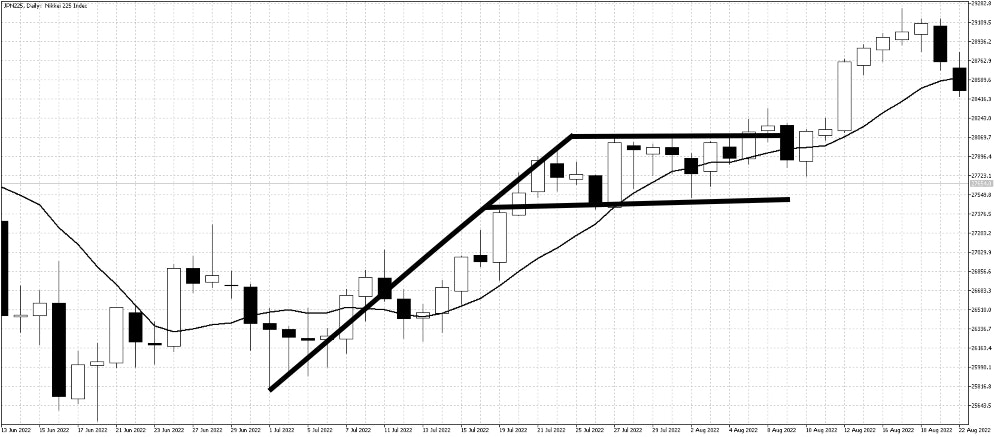
Nikkei 225 daily chart bullish flag

The Nikkei index rose quickly from 27,000 to 28,000 in the last two weeks of July 2022, only to find resistance. However, after the consolidation period ended, the market broke the top of the flag and continued the uptrend.
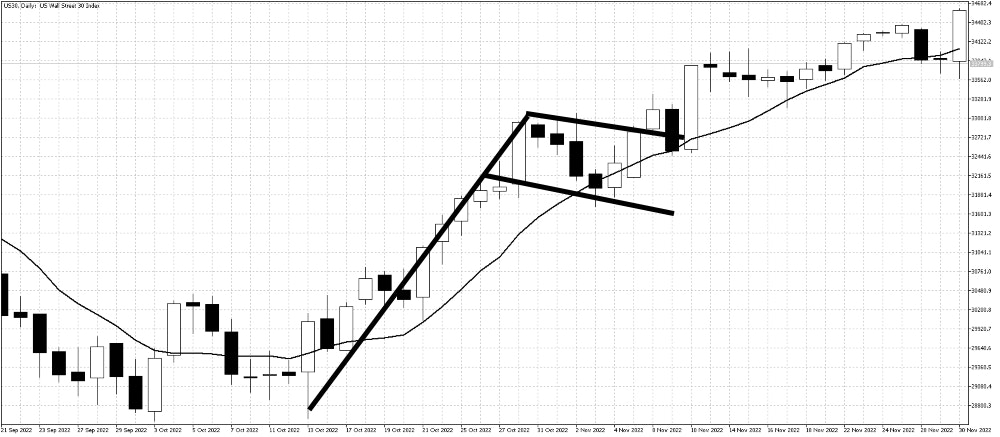
Dow Jones Index daily chart bullish flag

The Dow Jones Index found support in October 2022 and recovered as investors looked to buy cheap shares. Following a quick rally to the end of October, a flag pattern started to form as the market paused. A resistance break at 33,000 renewed buyers' confidence to push the market higher.
USDJPY daily chart bullish flag

The USDJPY had multiple bullish flag patterns in 2022 as the market rose on higher US interest rates.
Of course, a bullish flag pattern may not always break higher, and other news or factors may change the outcome, so other technical indicators and analyses can be beneficial. Also, you should always think about the bigger picture of the market and be aware of any fundamental factors that may be driving demand at that time.
Bullish flag risk management advice
Target setting
There are two approaches to target setting when following an uptrend. The first approach is to set the target at resistance, usually a previous high or previous low. In a strong uptrend, there might not be resistance so the trader could place their profit target at 2 to 3 times their stop loss.
The second approach does not place a target and uses a trailing stop. As the market rises, the stop loss order level increases, allowing the trader to extend their profits in strong trends. A trailing stop is usually placed below an upward-pointing moving average or trend line.
Stop loss setting
Not all bullish flag patterns end with profits, so a stop loss is required. Usually, the stop loss is placed just below the top or bottom of the flag, depending on the trader's position holding time frame. A reversal of a bullish flag can lead to a significant fall, so it is important not to add to losing positions and exit losses quickly.
Bullish flag mental control advice
A bullish flag pattern is subjective and different traders can see different patterns in the charts. Therefore, traders must trust their analysis to minimize stress and follow their trading rules.
The bullish flag pattern is a trend-following strategy so that the winning percentage can be below 50%, like other trend-following strategies. It is important not to focus on short-term performance and achieve a high-risk reward ratio (average profits greater than average losses) to be successful over the long run.
The bullish flag pattern is rare but powerful when used correctly. Practice finding bullish flags on historical charts to improve your skills, and remember successful technical analysis takes judgment and experience.

