Nick Goold
Gold
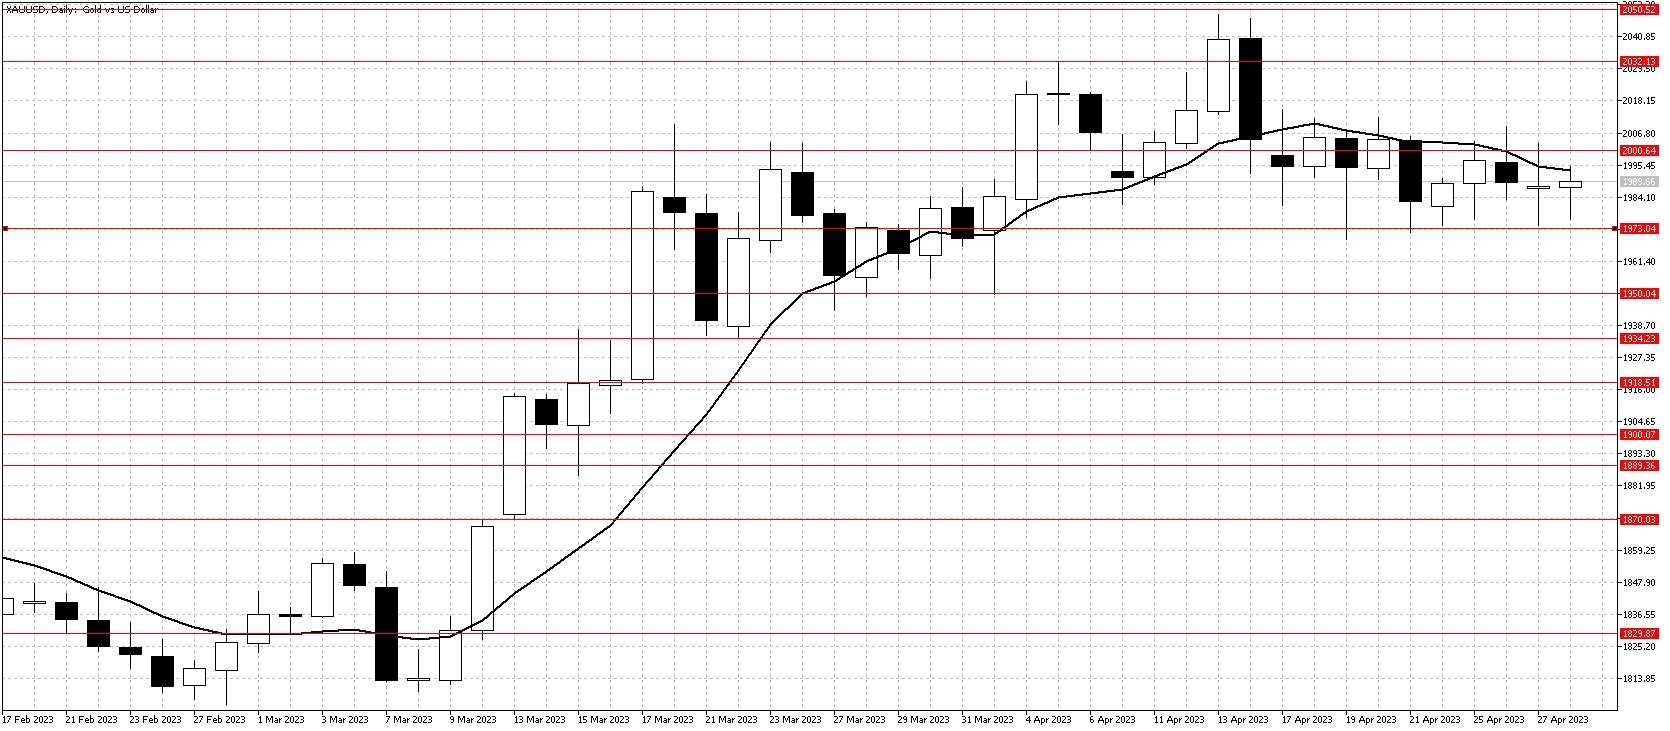
A quiet week for Gold as resistance at $2,000 continues to cap prices. Despite renewed fears about the US bank sector, Gold failed to make gains on the week. The stronger USD saw Gold under pressure for most of the week, but with few significant news announcements, support held $1,973.
Also, the renewed strength in equities increased investors' risk appetite and reduced buying interest in Gold. In the week ahead, all eyes will be on the FOMC decision, where interest rates will likely rise by 0.25%. Gold will be vulnerable to a significant fall should the Federal Reserve indicate further interest rate rises are required to control inflation.
Predicting the end of a range trading market we currently experience is difficult. However, in current conditions, expect range trading conditions to continue and avoid trading a breakout until a new trend is formed.

Resistance: 2000, 2032, 2050, 2070
Support: 1973, 1950, 1935, 1918, 1900
WTI
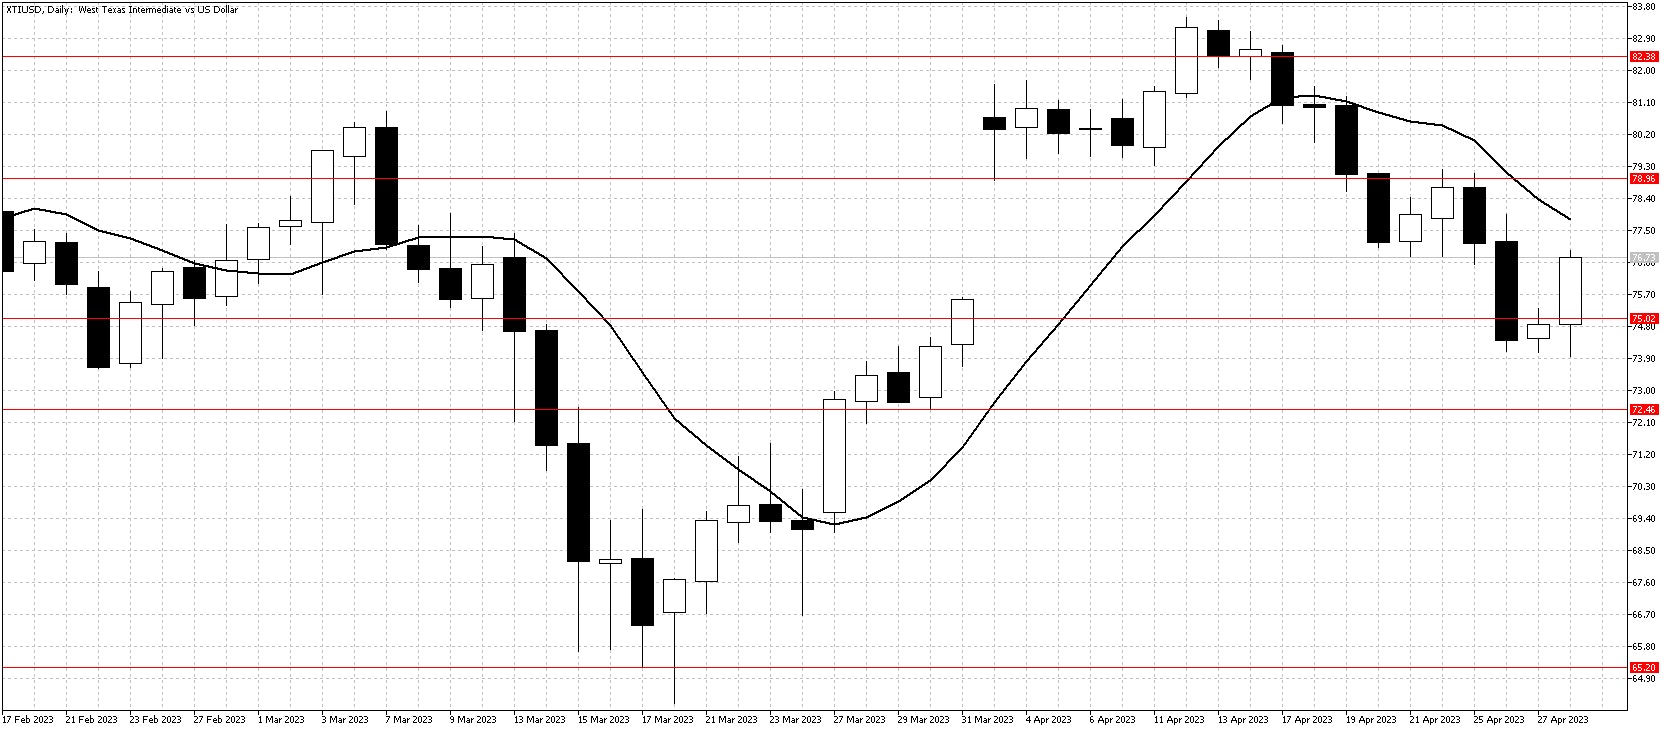
Following the failure to move about $82.50 resistance earlier in April, WTI continued to come under pressure this week. Worries about a slowdown in the US economy, confirmed by the weaker-than-expected USD GDP figures, encouraged sellers to target a test of $72.50 support.
There was a recovery Friday following data showing rising oil demand and lower output, but not enough to break the recent downtrend. The $75 level has provided support in the past, so while WTI could be under further pressure from a strong USD this week, the falls look likely to be limited. This week, the best strategy is looking for range trading opportunities for short-term traders and buying opportunities for medium-term traders.

Resistance: 79.00, 82.50, 85.00, 90.00
Support: 75.00, 72.50, 70.00, 65.00, 62.00

