
Nick Goold
Gold
Gold finally broke below $1,900 last week as robust economic data and equity markets reduced the investment appeal of Gold. The break of support proved short-lived, though, with the market pushing higher on Friday as the lower-than-expected US inflation data reduced the chance of further US interest rises.
The week ahead sees many economic data releases again, with ISM, Non-farm payrolls being the highlight after the US Independence Day holiday. Also, Gold traders will closely watch the release of the minutes of the last Federal Reserve meeting.
The quick recovery back above $1,900 is positive for Gold, and if prices can rise above the 10-day moving average line, further gains are possible. Overall the market is still looking for direction, so short-term range trading looks to remain the best trading strategy.
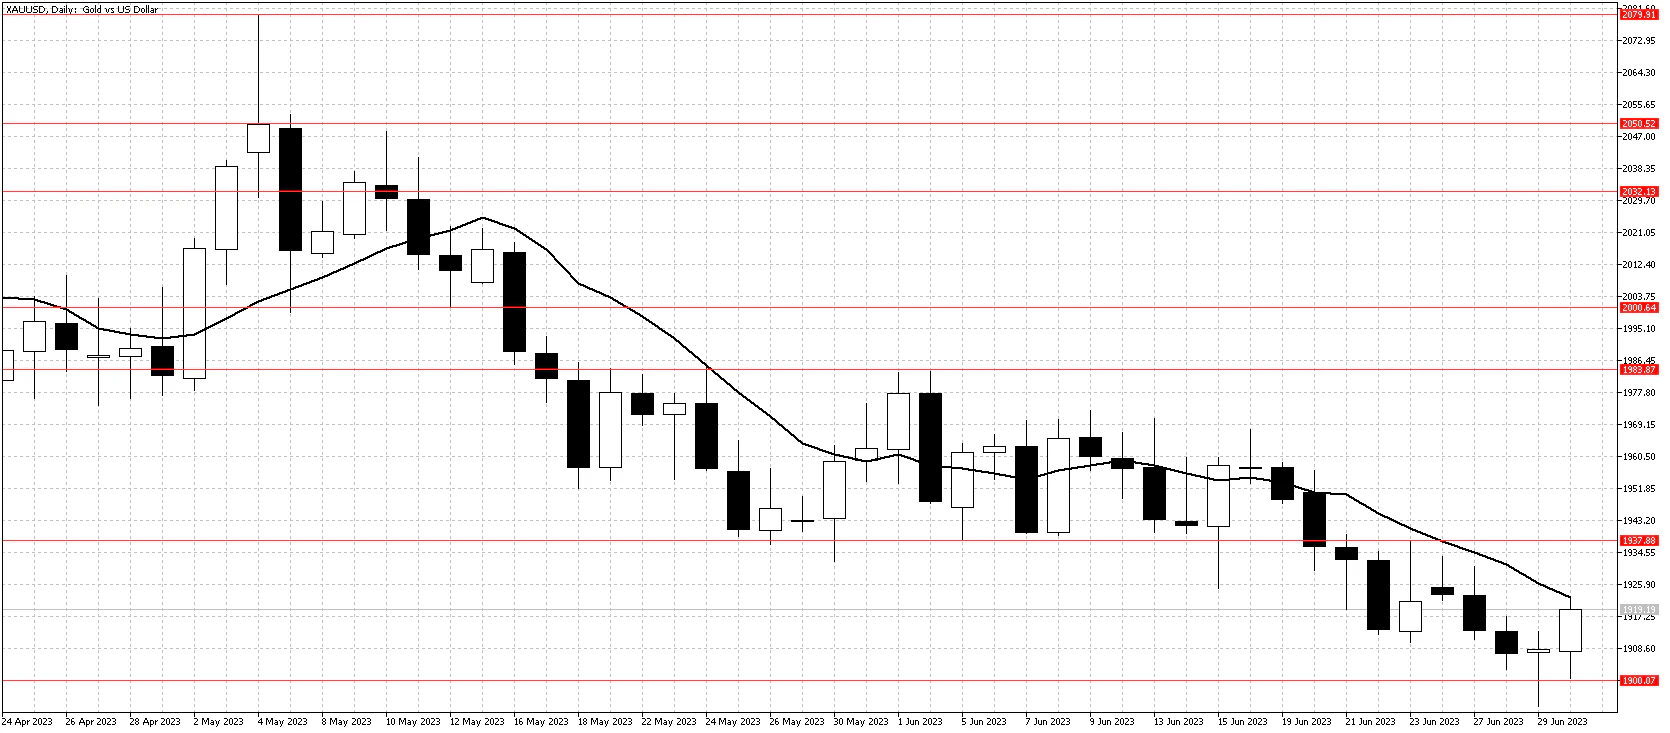
Resistance: 1938, 1984, 2000, 2032, 2050, 2080
Support: 1900, 1889, 1870, 1830
WTI
Weaker-than-expected Chinese factory data saw WTI touch $67 support again last week. Support held easily, though as better than expected US data reduce the probability of a US recession in the second half of this year.
Saudi Arabia's plans to cut output by a further 1 million barrels per day in July, along with the broader OPEC+ deal to limit supply into 2024, is also providing support to WTI prices.
With the 10-day moving average remaining flat and other indicators also lacking direction, only two current strategies exist. Short-term momentum trading following the daily trend or being patient and trading the $67.50 to $72.50/$75.00 range for medium-term traders.
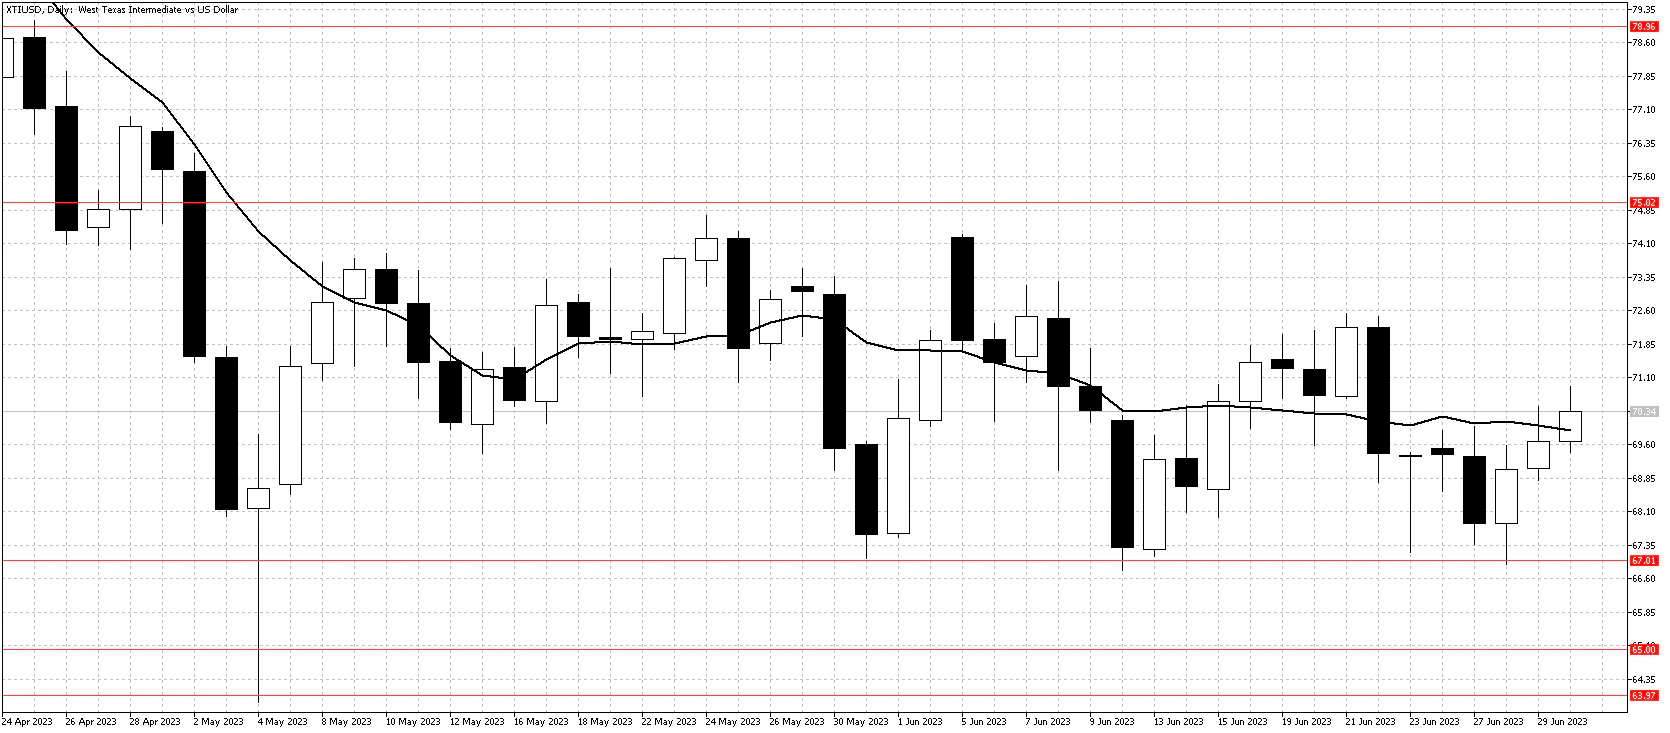
Resistance: 75.00, 79.00, 82.50
Support: 67.00, 65.00, 64.00, 62.00
