Nick Goold
Gold
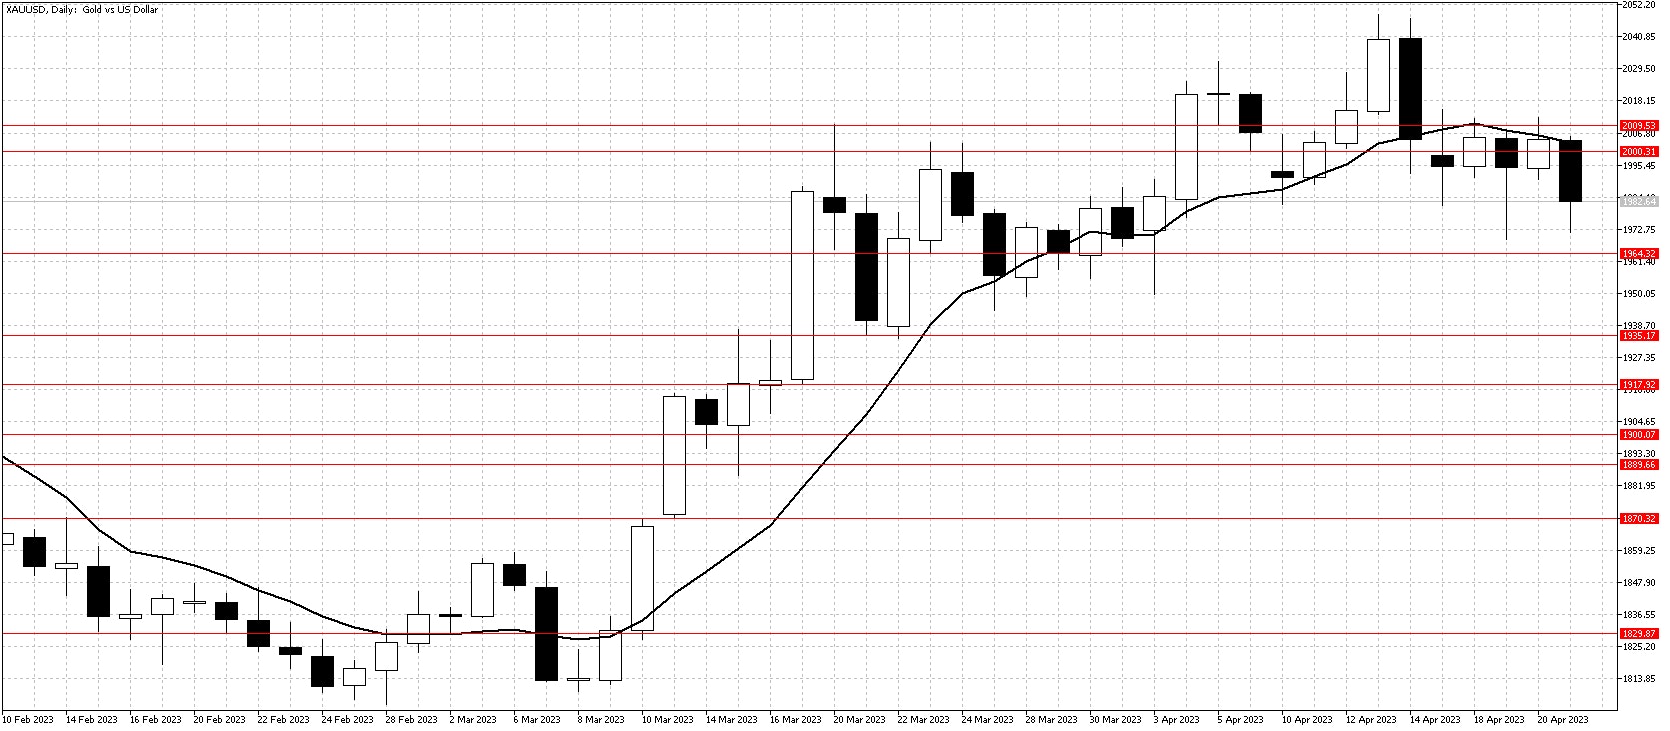
Worries about the future role of the US dollar helped Gold rise significantly in the past two months, but resistance at $2,000 remains. In addition, the strong US manufacturing data Friday was bearish for Gold prices as the market expects further interest rate rises from the US federal reserve.
In the week ahead, there is little news apart from US GDP on Thursday that is likely to cause significant movements in Gold so traders will focus on chart analysis. Additionally, the equities markets are quiet, so that the USD could provide direction this week.
The Gold chart is increasingly negative now that prices have closed the week below $2,000, and the 10-day moving average is pointing lower. The uptrend has helped many traders make profits, but further long liquidation could see prices test $1,950 in the week ahead.

Resistance: 2000, 2032, 2050, 2070
Support: 1985, 1950, 1935, 1918, 1900
WTI
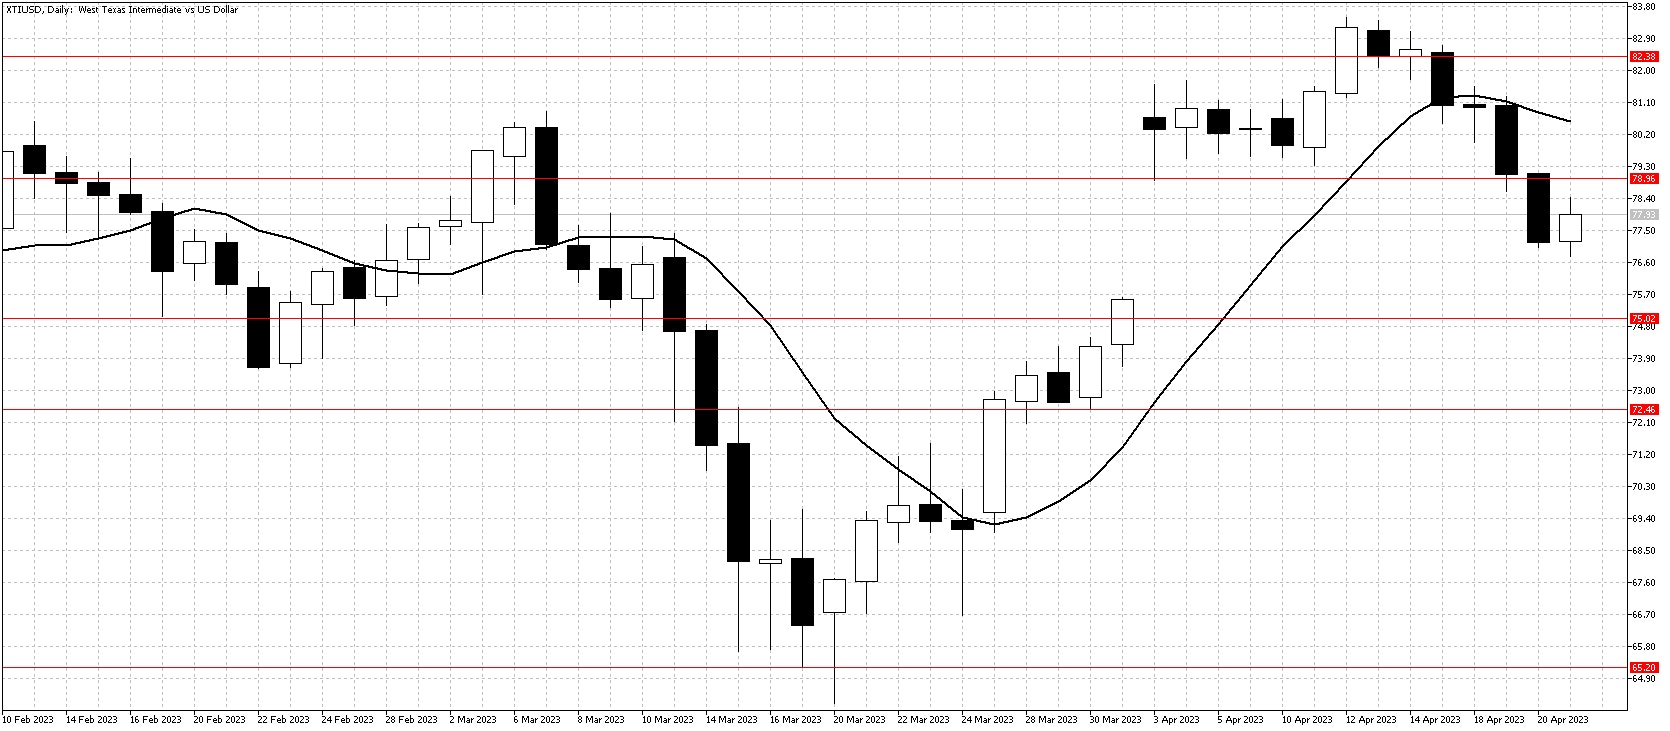
Long-term resistance at $82.50 encouraged sellers to be active, pushing WTI lower last week. However, persistently high inflation will likely see central banks in the US, Europe, and the UK continue to raise interest rates, preventing WTI from increasing. In addition, the announcement of higher oil inventories in the US last week weakened sentiment.
While in the short term, lower levels are possible as traders search for the next level of support around the $72.50 and $75.00 levels. In the coming week, expect buyers to return and sideways price action between $75 and $80.

Resistance: 79.00, 82.50, 85.00, 90.00
Support: 75.00, 72.50, 70.00, 65.00, 62.00

