Nick Goold
Gold
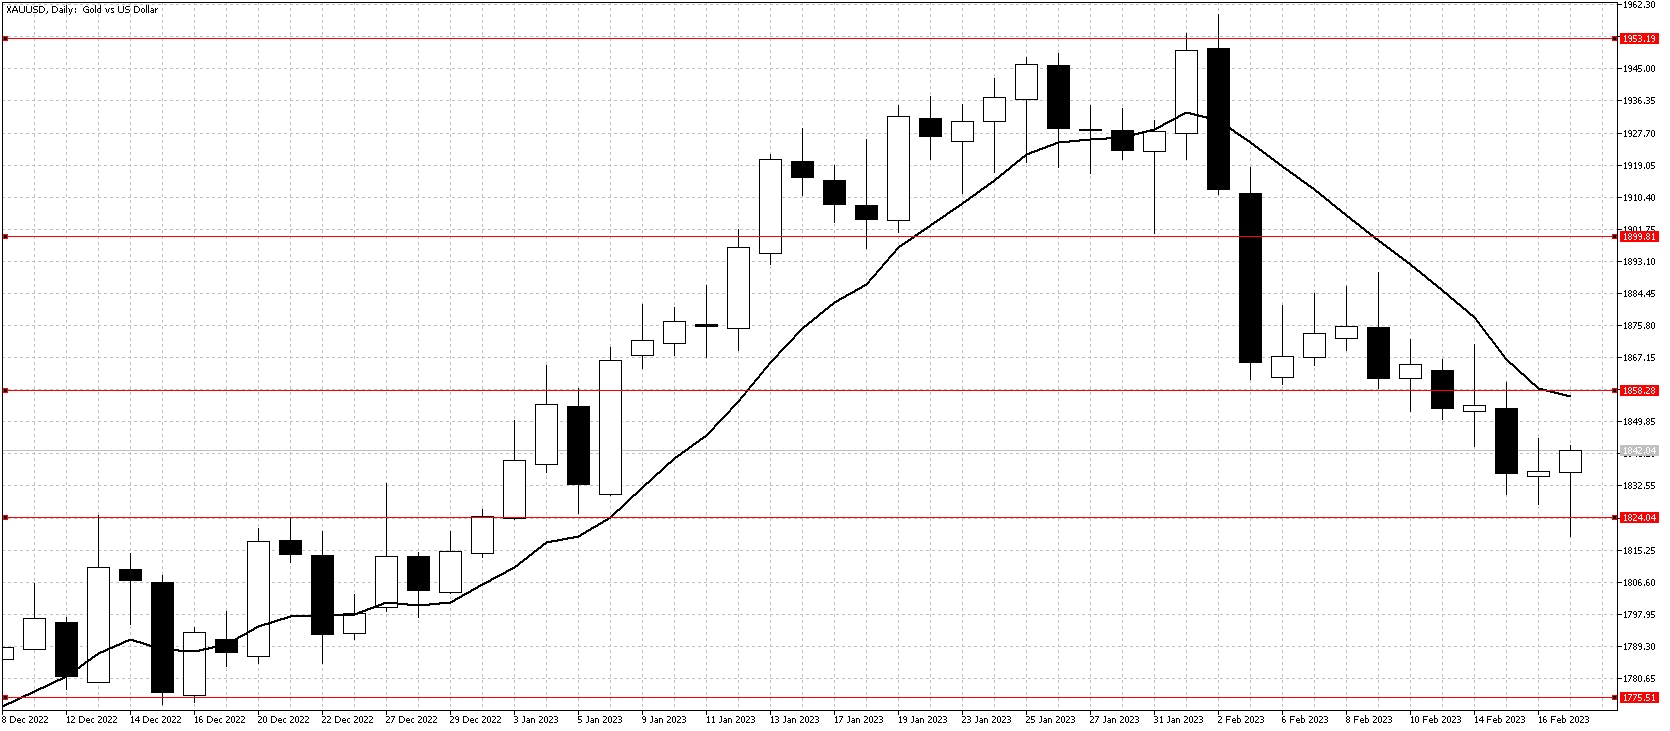
Another week of losses for Gold as expectations of higher US interest rates and the strong USD gave seller confidence to push prices lower. Higher than expected US inflation data and the strong US Retail Sales saw 10 year US bond yields rise to 3.82 which is close to the highest level in 2023.
There was an encouraging sign for Gold though last week as important support at 1820 held. Friday`s price action was positive as despite the market testing lower Gold managed to close with a gain on the day. This pattern is called a key reversal and could signal the start of an uptrend.
Resistance remains 1850 and the 10 day moving average so it is a little too soon to get too excited about a rise at these levels. This week focusing on buying opportunities if the market stays above $1820 looks to be the best strategy.

Resistance: 1850, 1870, 1890, 1900, 1916, 1937, 1950, 1960
Support: 1818.50, 1800, 1775, 1760
WTI
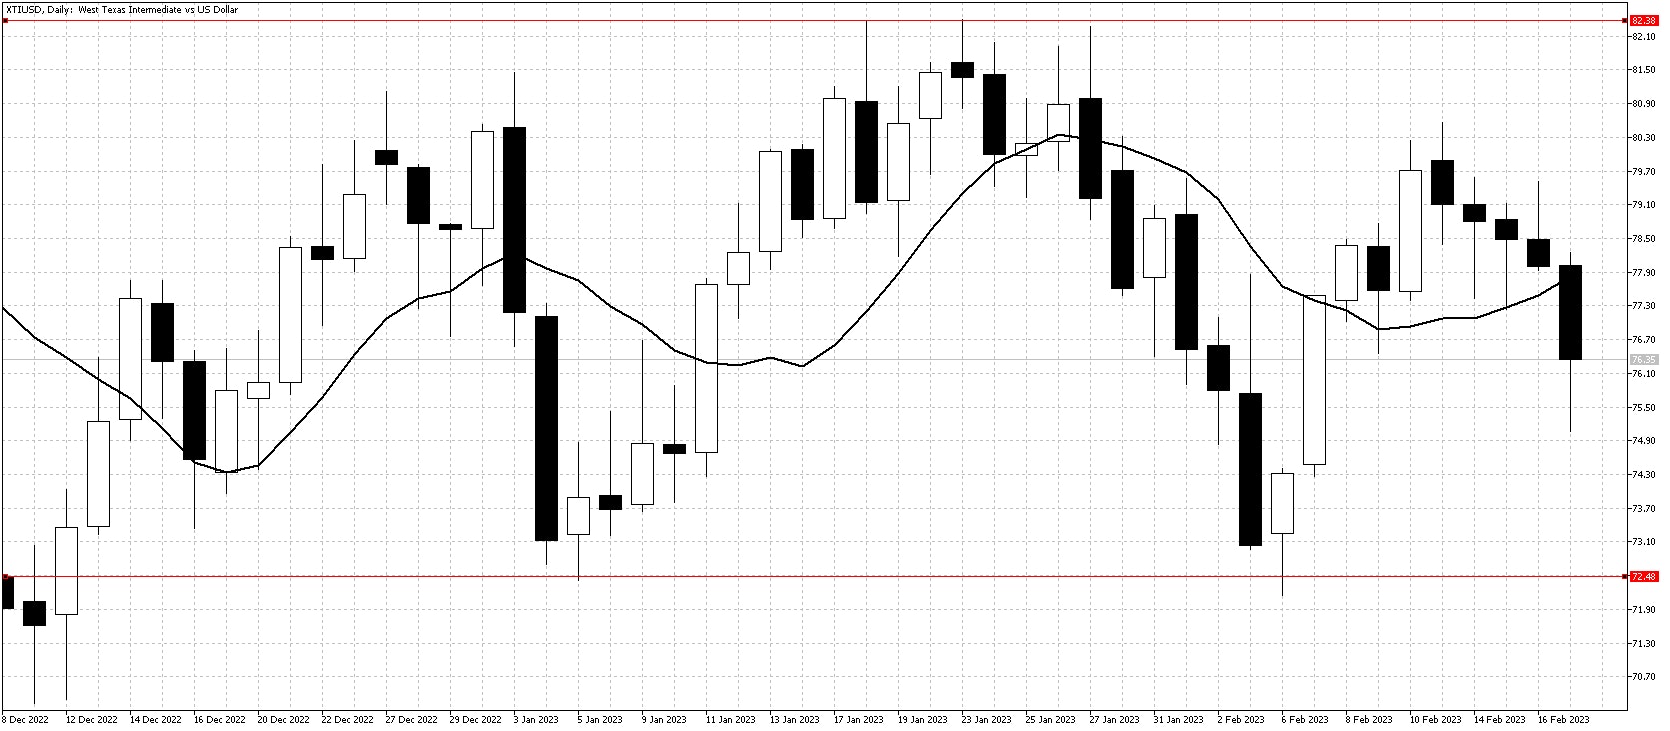
WTI prices came under pressure again last week after failing at $80 resistance. Increased inventories of WTI in the US gave bears a reason to sell towards the end of week. Worries that the US Federal Reserve will need to keep increasing interest following the strong economic data saw traders predict a decrease in US oil demand.
Support at $75 held which is positive and current prices remain in a $72 to $82 range. In the short term given the poor close on Friday prices could test lower at the start of week. There are few news events expected this week so it is unlikely the recent range will break so look for higher prices towards the end of the week.

Resistance: 80.50, 82.70, 84.00, 90.00
Support: 75.00, 72.50, 70.00, 66.00

