
Aayush Jindal
Key Highlights
- Crude oil price traded to a new multi-month high at $67.92 before correcting lower.
- A key bearish trend line is forming with resistance near $65.60 on the 4-hours chart of XTI/USD.
- Gold price is recovering, but it could face resistance near $1,760.
- The fed interest rate decision is lined up today (forecast 0.25%, versus 0.25% previous).
Crude Oil Price Technical Analysis
In the past few weeks, crude oil price saw a steady increase above the $60.00 pivot against the US Dollar. The price broke the $65.00 level and traded to a new multi-month high.
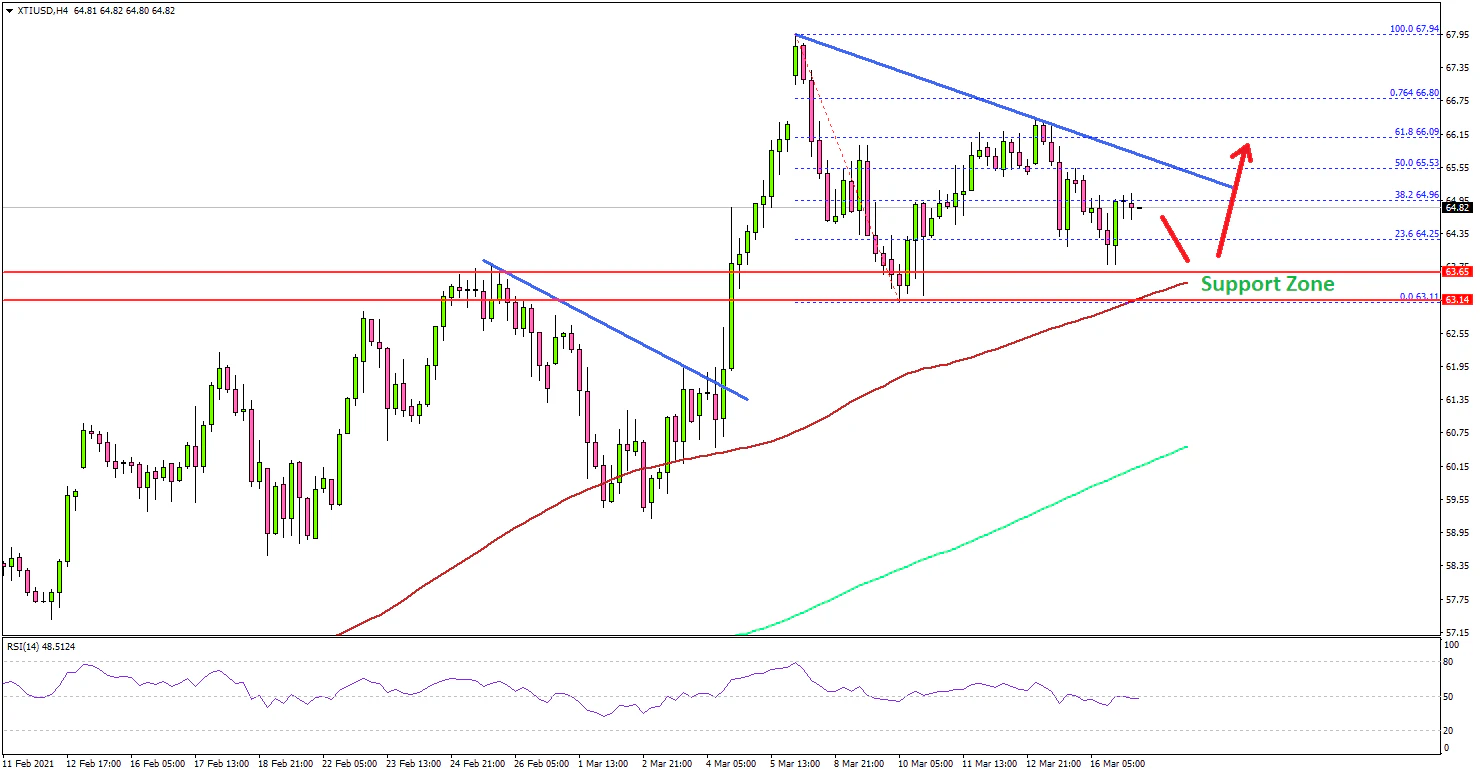
Looking at the 4-hours chart of XTI/USD, the price traded as high as $67.94, and it settled well above the 100 simple moving average (red, 4-hours) and the 200 simple moving average (green, 4-hours).
Recently, there was a downside correction below the $66.00 and $65.00 levels. The price found support near $63.20 and it started a fresh increase. It climbed above $65.50, but the bulls struggled above $66.00.
There is also a key bearish trend line forming with resistance near $65.60 on the same chart. A clear break above the trend line resistance and $66.00 could open the doors for a fresh increase.
On the downside, the $63.20 and $63.00 levels are important supports. A downside break below $63.00 could possibly lead the price towards the $60.00 support level and the 200 SMA.
Fundamentally, the US Retail Sales figure for Feb 2021 was released yesterday by the US Census Bureau. The market was looking for a decline of 0.5% compared with the previous month.
The actual result was lower than the forecast, as the US Retail Sales declined 3%. On the other hand, the last reading was revised up from +5.3% to +7.6%.
Looking at EUR/USD and GBP/USD, both pairs are facing hurdles near 1.2000 and 1.4000 respectively. Similarly, gold price is likely to struggle near $1,750 and $1,760.
Economic Releases to Watch Today
- Euro Zone CPI for Feb 2021 (YoY) - Forecast +0.9%, versus +0.9% previous.
- Euro Zone CPI for Feb 2021 (MoM) - Forecast +0.2%, versus +0.2% previous.
- Canadian Consumer Price Index for Feb 2021 (MoM) – Forecast +0.7%, versus +0.6% previous.
- Canadian Consumer Price Index for Feb 2021 (YoY) – Forecast +1.3%, versus +1.0% previous.
- Fed Interest Rate Decision - Forecast 0.25%, versus 0.25% previous.
