
Aayush Jindal
Key Highlights
- Crude oil price started a strong recovery above $10.00 and $15.00 against the US dollar.
- A major bearish trend line was breached near $18.40 on the 4-hours chart of XTI/USD.
- The EIA Crude Oil Stocks could change 8.125M (weekly), down from the last 8.991M.
- The US ADP Employment could change -20050K in April 2020.
Crude Oil Price Technical Analysis
After a strong collapse, crude oil price started a recovery wave above $10.00. It surpassed many hurdles near $15.00 and $18.00 to move into a short term positive zone.
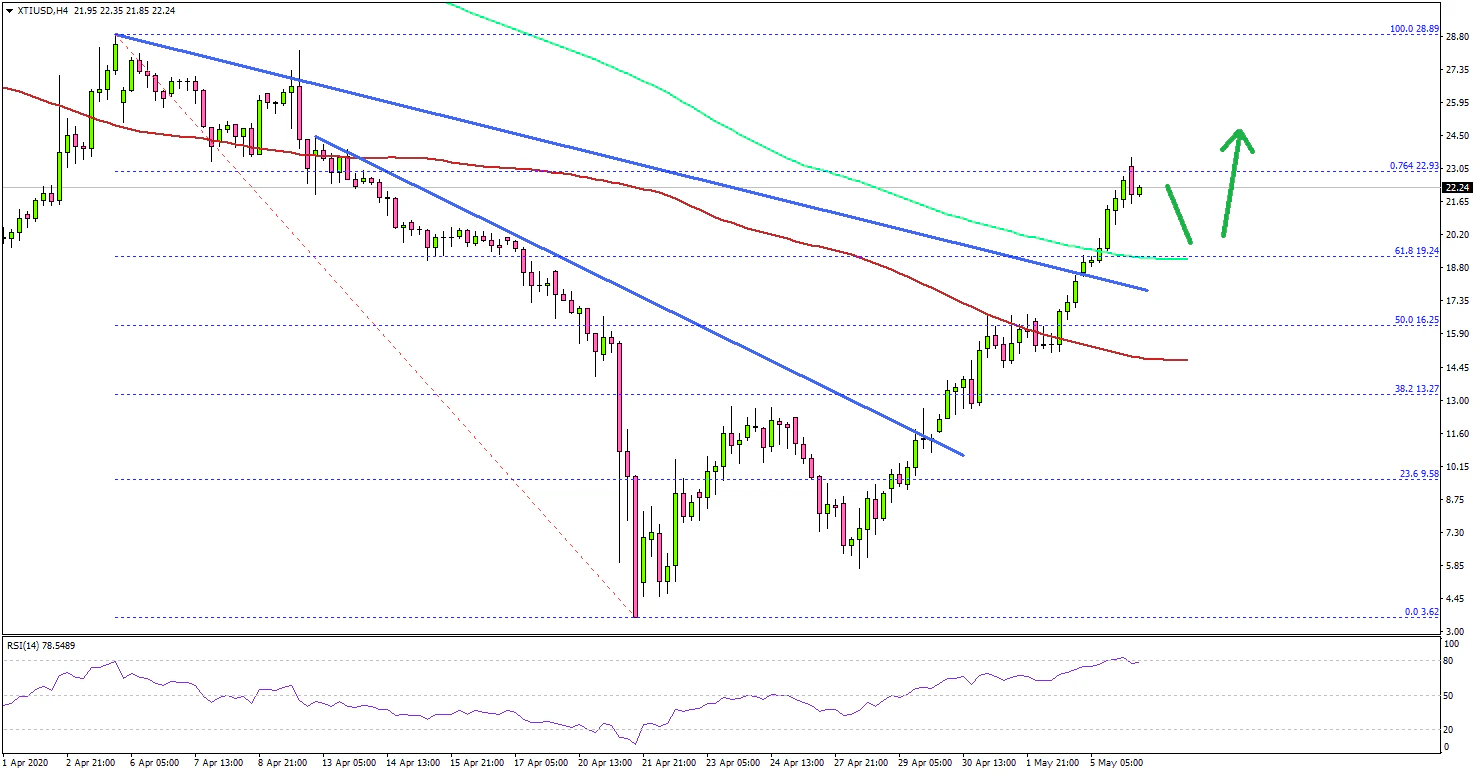
Looking at the 4-hours chart of XTI/USD, the price gained pace above $15.00 and the 100 simple moving average (red, 4-hours). There was a break above the 50% Fib retracement level of the last major decline from the $28.89 high to $3.62 low (spot price).
Moreover, there was a break above a major bearish trend line near $18.40. It opened the doors for more gains above $20.00, the 200 simple moving average (green, 4-hours), and the 61.8% Fib retracement level of the last major decline from the $28.89 high to $3.62 low.
If there is a successful daily close above $22.00 and $22.50, the price is likely to continue higher. The next key resistance is near the $24.50 and $25.00 levels.
Conversely, there could be a downside correction below the $18.00 level. In the mentioned case, the spot price could revisit the $15.00 support level and the 100 simple moving average (red, 4-hours).
Looking at major pairs, EUR/USD failed to stay above the 1.0900 and 1.0880 support levels. Moreover, GBP/USD is likely to struggle near 1.2500 and it might continue lower.
Economic Releases to Watch Today
- Germany’s Services PMI for April 2020 - Forecast 15.9, versus 15.9 previous.
- Euro Zone Services PMI for April 2020 – Forecast 11.7, versus 11.7 previous.
- UK Services PMI for April 2020 – Forecast 22.0, versus 39.3 previous.
- US ADP Employment Change April 2020 - Forecast -20050K, versus -27K previous.
- EIA Crude Oil Stocks Change – Forecast 8.125M, versus 8.991M previous.
