
Aayush Jindal
Key Highlights
- Crude oil price started a fresh increase from the $66.25 support zone.
- It broke a major bearish trend line with resistance near $69.50 on the 4-hours chart of XTI/USD.
- EUR/USD could gain pace if it breaks the 1.1350 resistance.
- The US GDP increased 2.3% in Q3 2021, more than the market forecast (2.1%).
Crude Oil Price Technical Analysis
This week, crude oil price started a major decline from $72.90 against the US Dollar. The price traded below the $70.00 support to enter a short-term bearish zone before starting a fresh increase.
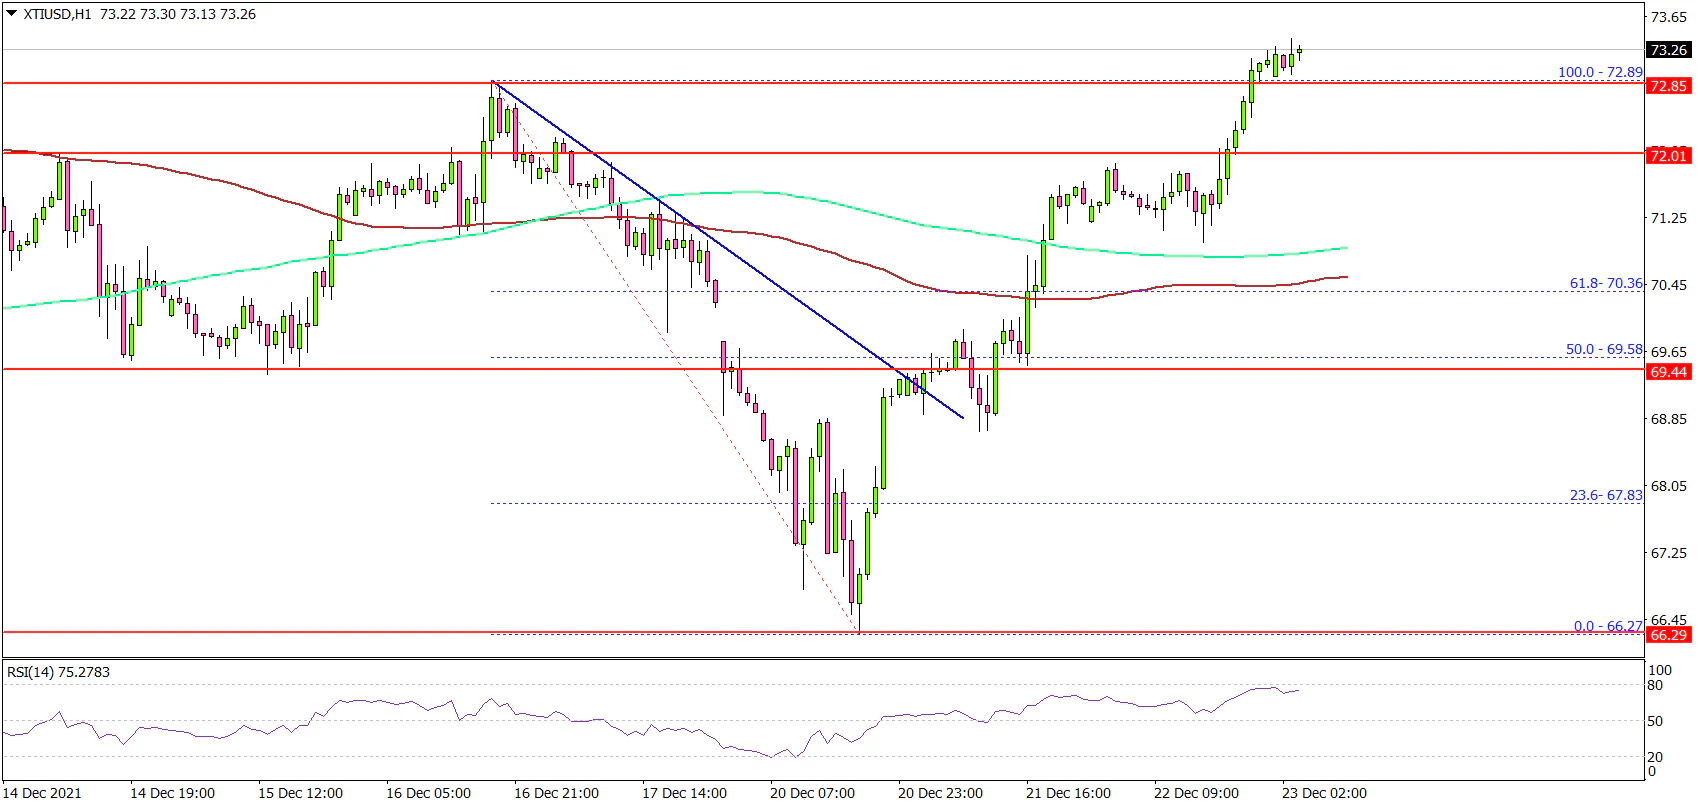
Looking at the 4-hours chart of XTI/USD, the price even traded below the $68.00 support, the 100 simple moving average (4-hours, red) and the 200 simple moving average (4-hours, green).
However, the bulls were active near the $66.25 zone. A low was formed near $66.27 and there was a sharp upward move. There was a break above a major bearish trend line with resistance near $69.50 on the same chart.
The pair settled above $70.00, the 100 simple moving average (4-hours, red) and the 200 simple moving average (4-hours, green).
The price is now facing resistance near the $73.20 zone. A close above $73.20 could start a steady increase towards the $74.50 level. The next major resistance is near the $75.00 level.
An immediate support on the downside is near the $72.00 level. The first major support is near $70.00. Any more losses could open the doors for a move towards the $68.25 support.
Fundamentally, the US Gross Domestic Product report for Q3 2021 was released by the US Bureau of Economic Analysis. The market was looking for a growth of 2.1%.
The actual result was above the market forecast, as the US Gross Domestic Product increased 2.3% in Q3 2021. Besides, the GDP price index increased 6%, up from the last 5.9%.
Looking at EUR/USD, the pair could attempt a strong recovery if there is a clear move above 1.1350. Similarly, GBP/USD must clear 1.3400 for more upsides.
Economic Releases to Watch Today
- US Initial Jobless Claims - Forecast 205K, versus 206K previous.
- US Durable Goods Orders for Nov 2021 – Forecast +1.5% versus -0.4% previous.
