
Aayush Jindal
Key Highlights
- Crude oil price started a fresh increase above the $85.50 and $88.00 resistance levels.
- A major bullish trend line is forming with support near $88.40 on the 4-hours chart.
- Gold price failed to clear the $1,730 resistance and trimmed gains.
- EUR/USD and GBP/USD seem to be consolidating losses.
Crude Oil Price Technical Analysis
Crude oil price started a fresh increase from the $76.80 zone against the US Dollar. The price gained pace for a move above the $80.00 resistance level.
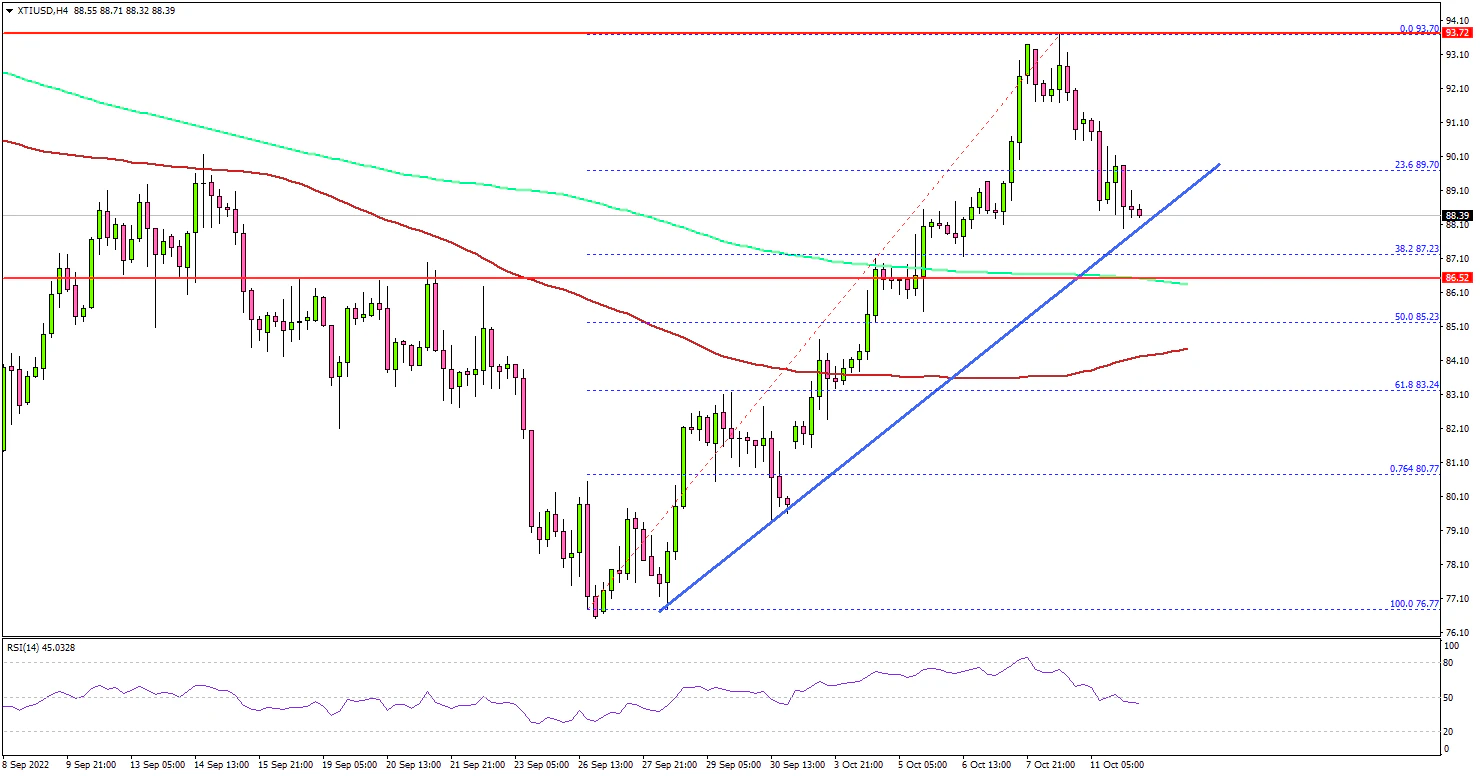
Looking at the 4-hours chart of XTI/USD, there was a break above the $85.00 resistance zone. The price even settled above the $86.50 level, the 100 simple moving average (red, 4-hours), and the 200 simple moving average (green, 4-hours).
There was a clear move above the $88.00 and $90.00 levels. It traded as high as $93.70 and recently there was a minor downside correction.
The price dipped below the $90.00 level. There was a move below the 23.6% Fib retracement level of the upward move from the $76.77 swing low to $93.70 high. However, there are many supports on downside, starting with $88.40 and a connecting bullish trend line.
The next major support is near $85.00 zone. It is near the 50% Fib retracement level of the upward move from the $76.77 swing low to $93.70 high.
Any more losses might call for a test of the $82.50 zone. On the upside, the price might face sellers near the $91.50 zone. The next major resistance is near $93.80, above which the price could accelerate higher towards the $95.00 zone.
Looking at gold price, there was a fresh bearish wave after the price failed to clear the $1,730 resistance. It is now consolidating near the $1,675 zone.
Economic Releases to Watch Today
- UK Industrial Production for August 2022 (MoM) - Forecast -0.2%, versus -0.3% previous.
- UK Manufacturing Production for August 2022 (MoM) - Forecast 0%, versus +0.1% previous.
- US Producer Price Index for Sep 2022 (MoM) – Forecast 0.2%%, versus -0.1% previous.
- US Producer Price Index for Sep 2022 (YoY) – Forecast +8.4%, versus +8.7% previous.
