
Aayush Jindal
Key Highlights
- Crude oil price gained bullish momentum above $70.00 and $72.00.
- A major bullish trend line is forming with support near $71.50 on the 4-hours chart of XTI/USD.
- EUR/USD failed to settle above 1.1950, GBP/USD tested the 1.4000 resistance.
- The US Gross Domestic Product is likely to grow 6.4% in Q1 2021.
Crude Oil Price Technical Analysis
In the past few weeks, crude oil price followed a strong bullish path above $60.00 against the US Dollar. The price broke the $68.50 and $70.00 resistance levels to move further into a positive zone.
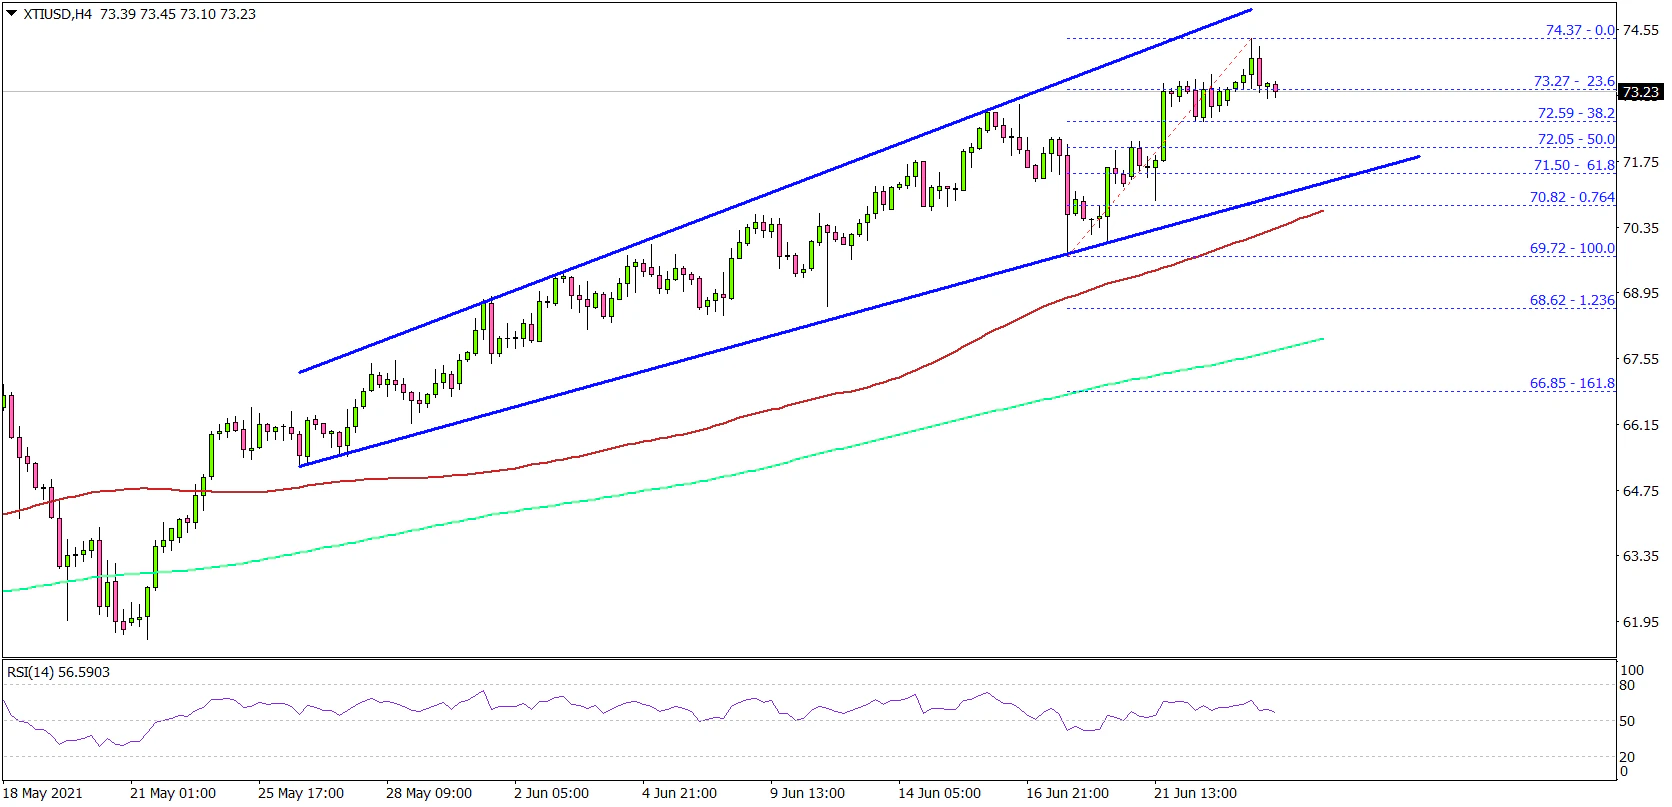
Looking at the 4-hours chart of XTI/USD, the price even settled nicely above the $70.00 zone, the 100 simple moving average (red, 4-hours), and the 200 simple moving average (green, 4-hours).
Finally, there was a break above the $72.00 level. The price traded to a new multi-month high near $74.37 and it is still trading in a strong uptrend. An initial support on the downside is near the $73.20 level.
The first major support is near $72.00. The 50% Fib retracement level of the upward move from the $69.72 low to $74.37 high is also near $72.00. There is also a major bullish trend line forming with support near $71.50 on the same chart.
If there is a downside break below $71.50, the price could decline towards the $70.00 support and the 100 SMA. The next major support is near the $68.00 level or the 200 SMA.
On the upside, the first major resistance is near the $75.00 level. A clear break above the $75.00 level could open the doors for a move towards the $80.00 level.
Looking at EUR/USD, the pair recovered above 1.1950, but it failed to extend gains. Similarly, GBP/USD might struggle to settle above 1.4000.
Economic Releases to Watch Today
- German IFO Business Climate Index for June 2021 – Forecast 100.6, versus 99.2 previous.
- BoE Interest Rate Decision - Forecast 0.1%, versus 0.1% previous.
- US Initial Jobless Claims - Forecast 380K, versus 412K previous.
- US Durable Goods Orders for May 2021 – Forecast +2.7% versus +-1.3% previous.
- US Gross Domestic Product Q1 2021 – Forecast 6.4% versus previous 6.4%.
