
Aayush Jindal
Key Highlights
- The Euro recovered nicely after testing the1.1025 support area against the US Dollar.
- EUR/USD is facing resistance near 1.1240 and abearish trend line on the 4-hours chart.
- China’s CPI in July 2019 increased 2.8% (YoY),more than the 2.7% forecast.
- GBP/USD is under a lot of pressure and recently declinedto a new multi-year low below 1.2050.
EUR/USD Technical Analysis
This past week, the Euro started a strong recovery from the 1.1027 swing low against the US Dollar. The EUR/USD pair climbed above the 1.1100 and 1.1150 resistance levels, but GBP/USD remained in a strong downtrend.
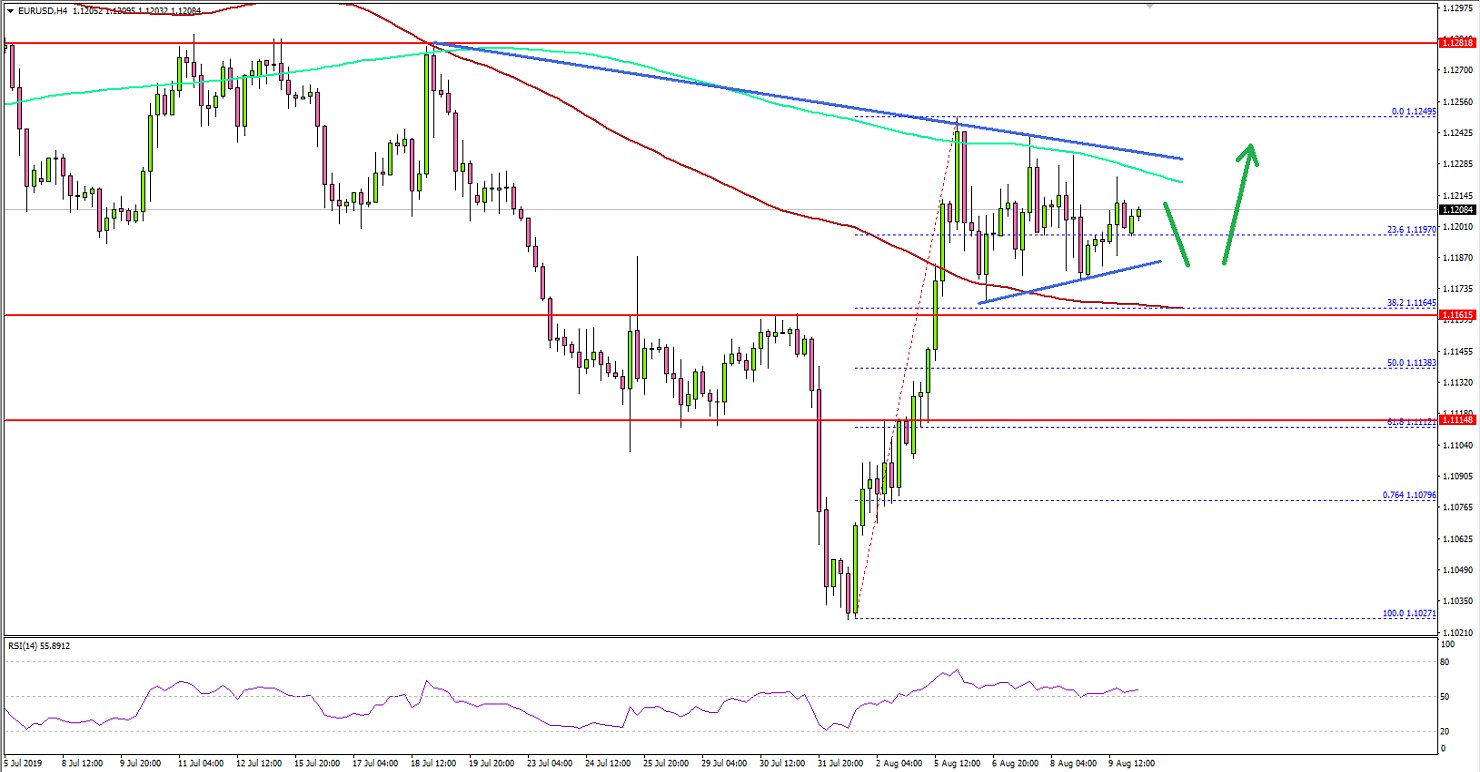
Looking at the 4-hours chart of EUR/USD, the pair recoverednicely above the 1.1100 pivot level. There was a successful close above the1.1150 resistance and the 100 simple moving average (red, 4-hours).
It opened the doors for more gains above the 1.1200 level.However, the upward move was capped by the 1.1250 resistance and the 200 simplemoving average (green, 4-hours). Moreover, there is a major resistance formingnear 1.1240 and a bearish trend line.
A swing high was formed at 1.1249 and the pair is currentlycorrecting gains. It traded below the 23.6% Fib retracement level of the recoveryfrom the 1.1027 low to 1.1249 high.
On the downside, the 1.1160 and 1.1150 levels are importantsupports. Besides, the 100 simple moving average (red, 4-hours) is also near1.1160 to act as a strong support.
If there is a daily close below 1.1150, EUR/USD could slideback towards the 1.1100 or 1.1080 support. Conversely, a successful break abovethe 1.1240 and 1.1250 resistance levels might push the pair towards the 1.1300resistance.
Looking at GBP/USD, there was a strong decline and the pairtraded to a new multi-year low below 1.2050. Conversely, gold price ralliedabove the $1,480 and $1,500 resistance levels. A new 2019 high was formed near$1,515 and the price is clearly in a strong uptrend.
