
Nick Goold
Minutes from the latest Federal Reserve meeting showed that officials have different views on interest rates. Some believe rates may need to rise again, while others think rate cuts could be needed if the economy becomes weaker. After WTI crude oil prices rose last week, traders will closely watch this week’s U.S. CPI and PPI inflation data. The results could change expectations for U.S. interest rates and affect the direction of the U.S. dollar.
In Japan, the government is still looking for ways to support the yen. One idea is to encourage the country’s largest pension fund to invest more in Japanese assets. This could increase demand for the yen.
This week, we will analyze AUD/JPY, CAD/CHF, EUR/JPY and USD/JPY. These pairs are part of Titan FX’s Trade Beyond Borders campaign, with zero-spread trading conditions available on selected popular FX pairs.
Each pair is being affected by different factors, including U.S. interest rate expectations, inflation data, oil prices, commodity currencies and yen movement. Each market should be analyzed separately to find the best trading opportunities.
Below, we look at each market’s daily chart outlook, average daily true range, key drivers and trading ideas.
Improving Your Trading with Support and Resistance
There are many useful indicators, but support and resistance are among the most important tools in FX trading. Support is an area where price has stopped falling before, while resistance is an area where price has stopped rising. These levels are usually based on previous highs and lows.
Support and resistance can help traders choose better entry points and decide where to place stop losses and profit targets. Common strategies include buying near support, selling near resistance, buying after resistance breaks and selling after support breaks.
There are also other possible strategies around these levels. One is to trade a failed breakout. If price moves above resistance but quickly falls back below it, traders may consider selling. If price moves below support but then returns above it, traders may consider buying.
Another possible strategy is to enter before a breakout when the market is in a strong trend. For example, a trader may buy as price moves toward resistance during an uptrend. If resistance holds, the trader may close the trade for a small profit or loss. If resistance breaks, the trade may benefit from a larger upward move.
Support and resistance are not perfect, but they make price action easier to understand. Using previous highs and lows can help traders plan entries, stops and targets more clearly.
AUD/JPY: Risk Sentiment and Yen Moves
AUD/JPY is a useful pair to watch because it is affected by both global risk sentiment and developments in Japan.
The Australian dollar often strengthens when investors feel confident about the global economy. Australia is a major exporter of commodities, so the currency can also react to changes in commodity prices and demand from China. When global growth expectations improve, the Australian dollar may rise. When concerns increase, it may weaken.
The yen side is also important. The yen often strengthens when traders become more cautious or when expectations of Japanese government action increase. This can push AUD/JPY lower.
As a result, AUD/JPY can move strongly when risk sentiment, commodity demand or expectations for the yen change.
Average daily true range: 73 pips (1 pip = 0.01).
Daily chart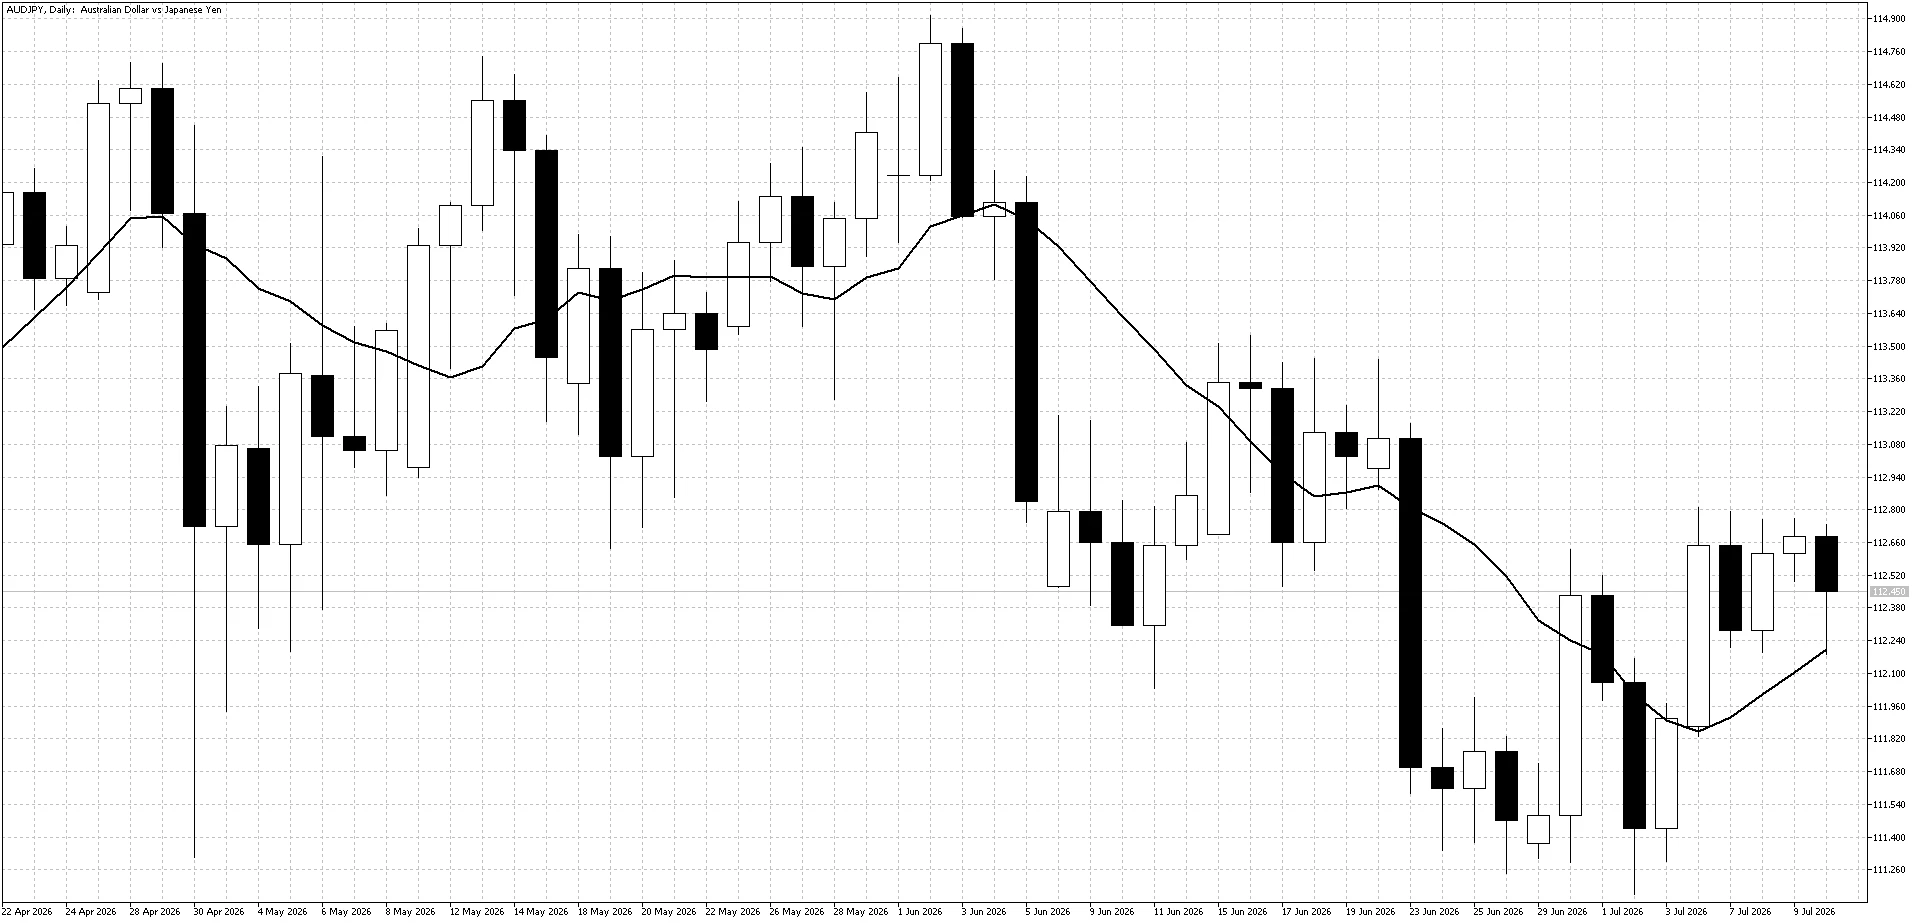
Current chart outlook
AUD/JPY has fallen from record highs after meeting resistance near 115 several times. However, the pair broke above its short-term downtrend last week as commodity prices strengthened and demand for the Australian dollar improved.
The 10-day moving average is now turning higher, suggesting that short-term momentum may be improving. Traders will watch whether AUD/JPY can continue rising and test the 115 resistance area again, or whether the pair returns to its recent range.
Key drivers
- Global risk sentiment
- Commodity price direction
- Chinese economic data and growth expectations
- Reserve Bank of Australia interest rate expectations
- Bank of Japan policy expectations
- Japan intervention risk
Trading ideas
Volatility has fallen recently, but daily price ranges are still large compared with many other FX pairs. This may continue to create good intraday trading opportunities.
In the short term, buying on weakness may be the better approach while momentum remains positive. Over the medium term, range trading may be more suitable, as the yen is unlikely to weaken significantly while intervention risk remains high.
CAD/CHF: Oil Prices and Safe-Haven Demand
CAD/CHF is useful to watch because it compares a commodity-linked currency with a safe-haven currency.
The Canadian dollar often reacts to oil prices because Canada is a major oil exporter. When oil prices rise, the Canadian dollar may strengthen. When oil prices fall, CAD can come under pressure.
The Swiss franc is often bought when traders become worried about the global economy or financial markets. This means CAD/CHF may rise when oil prices are strong and risk sentiment is positive, but fall when investors become more cautious and demand for CHF increases.
Average daily true range: 26 pips (1 pip = 0.0001).
Daily chart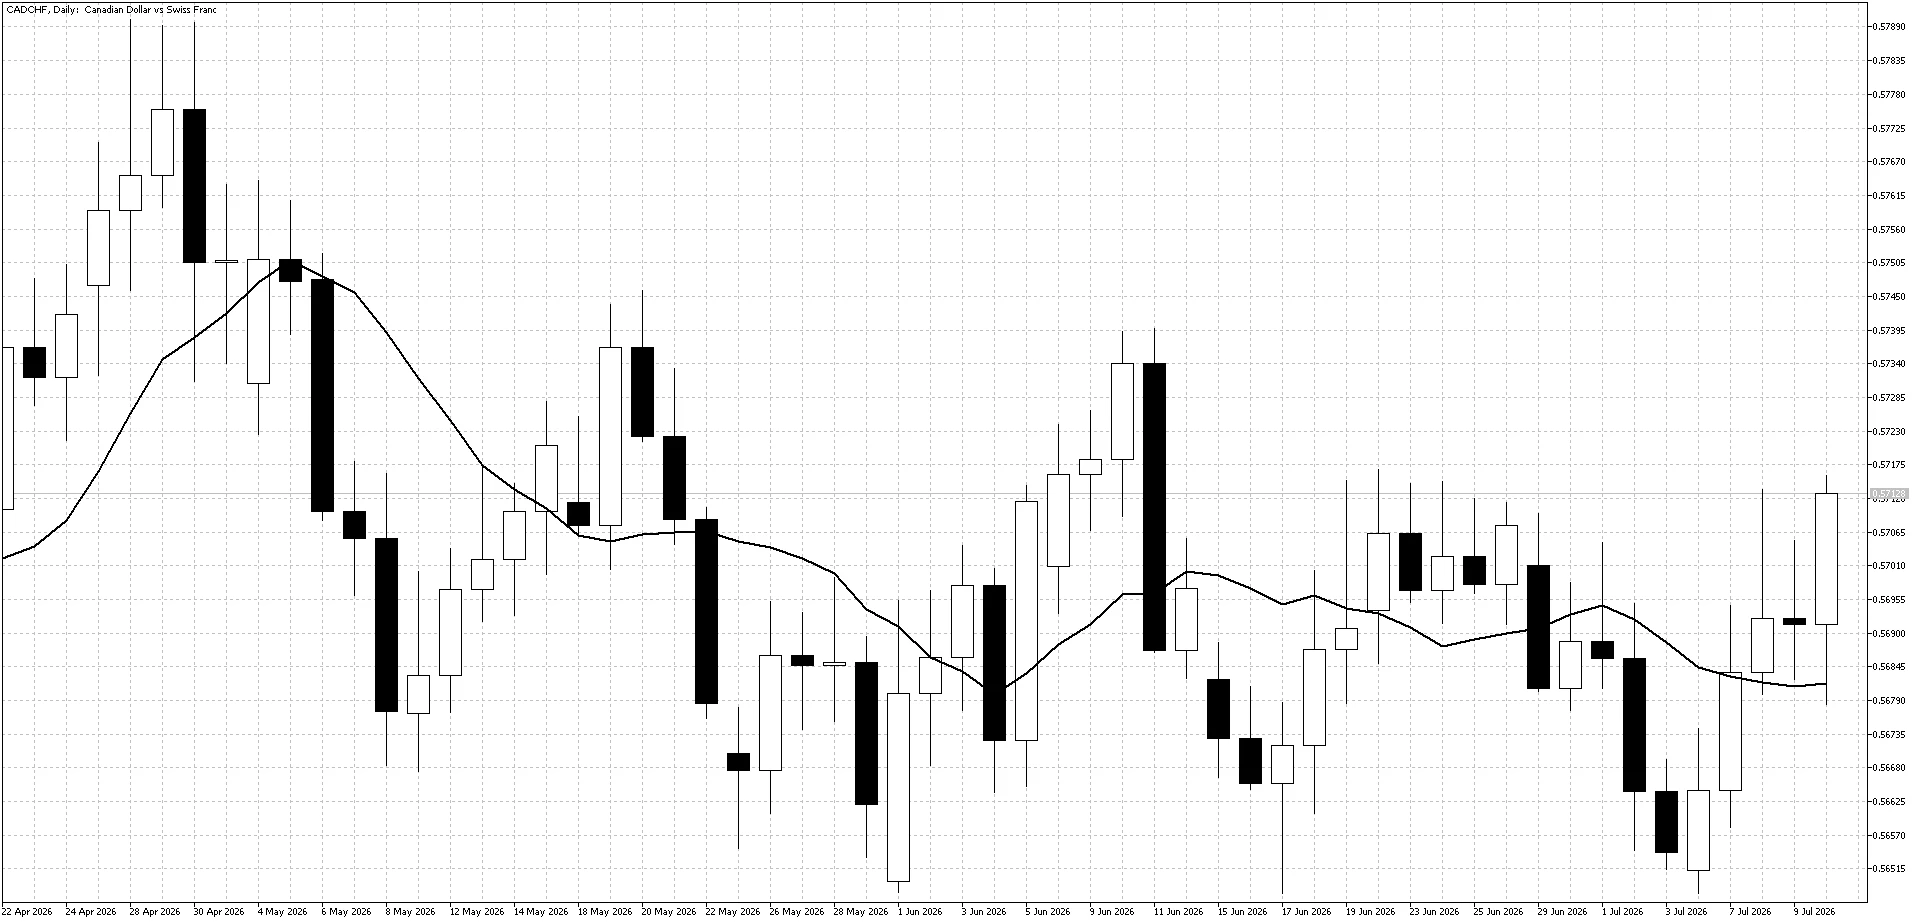
Current chart outlook
CAD/CHF has traded in a narrow range during 2026. Its average true range has recently fallen to around 26 pips, showing that volatility has become lower.
The 10-day moving average is also moving sideways, suggesting that the pair currently has no clear trend and may continue to trade within its recent range.
Key drivers
- Oil price direction
- Bank of Canada interest rate expectations
- Swiss National Bank policy expectations
- Safe-haven demand for the Swiss franc
- U.S. inflation and employment data
- Iran conflict and oil market headlines
Trading ideas
Day traders may find better opportunities in other FX pairs while CAD/CHF volatility remains low.
Patient medium-term traders may prefer to wait for range-trading opportunities. This could mean looking for selling opportunities near 0.5750 or buying opportunities near 0.5650 if the pair continues to stay within its current range.
EUR/JPY: Eurozone Outlook and Yen Moves
EUR/JPY can offer trading opportunities when the euro reacts to European economic data and the yen moves with changes in risk sentiment or Japanese policy expectations.
The pair is mainly driven by expectations for the European Central Bank and the Bank of Japan. Stronger Eurozone data or expectations of higher European interest rates can support the euro and push EUR/JPY higher.
The yen side is also important. If traders become more cautious or expect stronger action to support the yen, EUR/JPY may move lower. This makes the pair useful for comparing the outlook for Europe and Japan.
Average daily true range: 95 pips (1 pip = 0.01).
Daily chart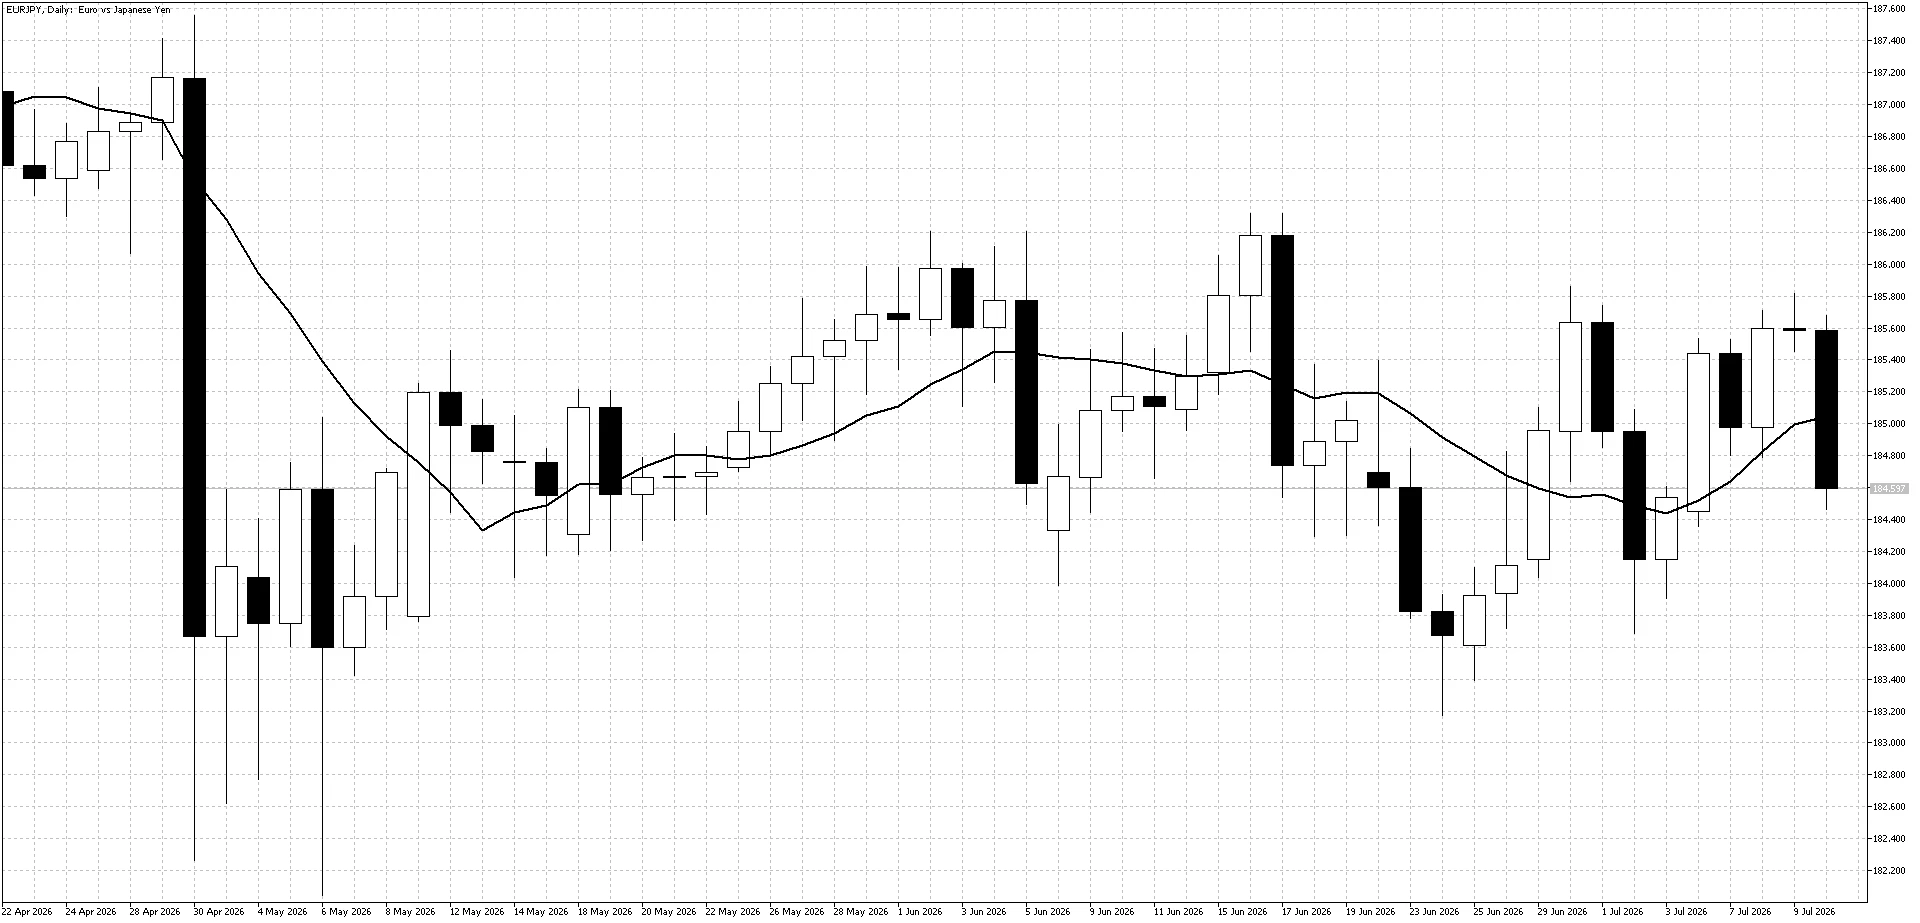
Current chart outlook
EUR/JPY has traded within a range over the past couple of months, but volatility has remained high for this popular FX pair.
Prices are currently near the middle of the recent range, while the 10-day moving average is also flat. This suggests that range-trading conditions may continue in the short term..
Key drivers
- European Central Bank interest rate expectations
- Bank of Japan policy expectations
- Eurozone inflation and economic data
- Japanese inflation and wage data
- Japan intervention risk
- Political and economic developments in Europe and Japan
Trading ideas
EUR/JPY is currently trading within a range between 183 and 186. Medium-term traders may prefer to look for range-trading opportunities near these levels.
Short-term traders may find more opportunities by using a 5-minute chart and following smaller intraday trends while the wider market remains in a range.
USD/JPY: Interest Rates and Yen Volatility
USD/JPY is one of the most active FX pairs because it reacts quickly to changes in U.S. interest rate expectations and Japanese yen movements.
The U.S. dollar often strengthens when traders expect U.S. interest rates to stay high or rise. Strong U.S. economic data can therefore push USD/JPY higher. Weaker data or expectations of rate cuts can put pressure on the pair.
The yen side is also important. The yen may strengthen when traders become more cautious or expect action from the Japanese government or Bank of Japan. This can cause USD/JPY to fall quickly.
As a result, USD/JPY can see strong moves when U.S. data, interest rate expectations or yen policy expectations change.
Average daily true range: 73 pips (1 pip = 0.01).
Daily chart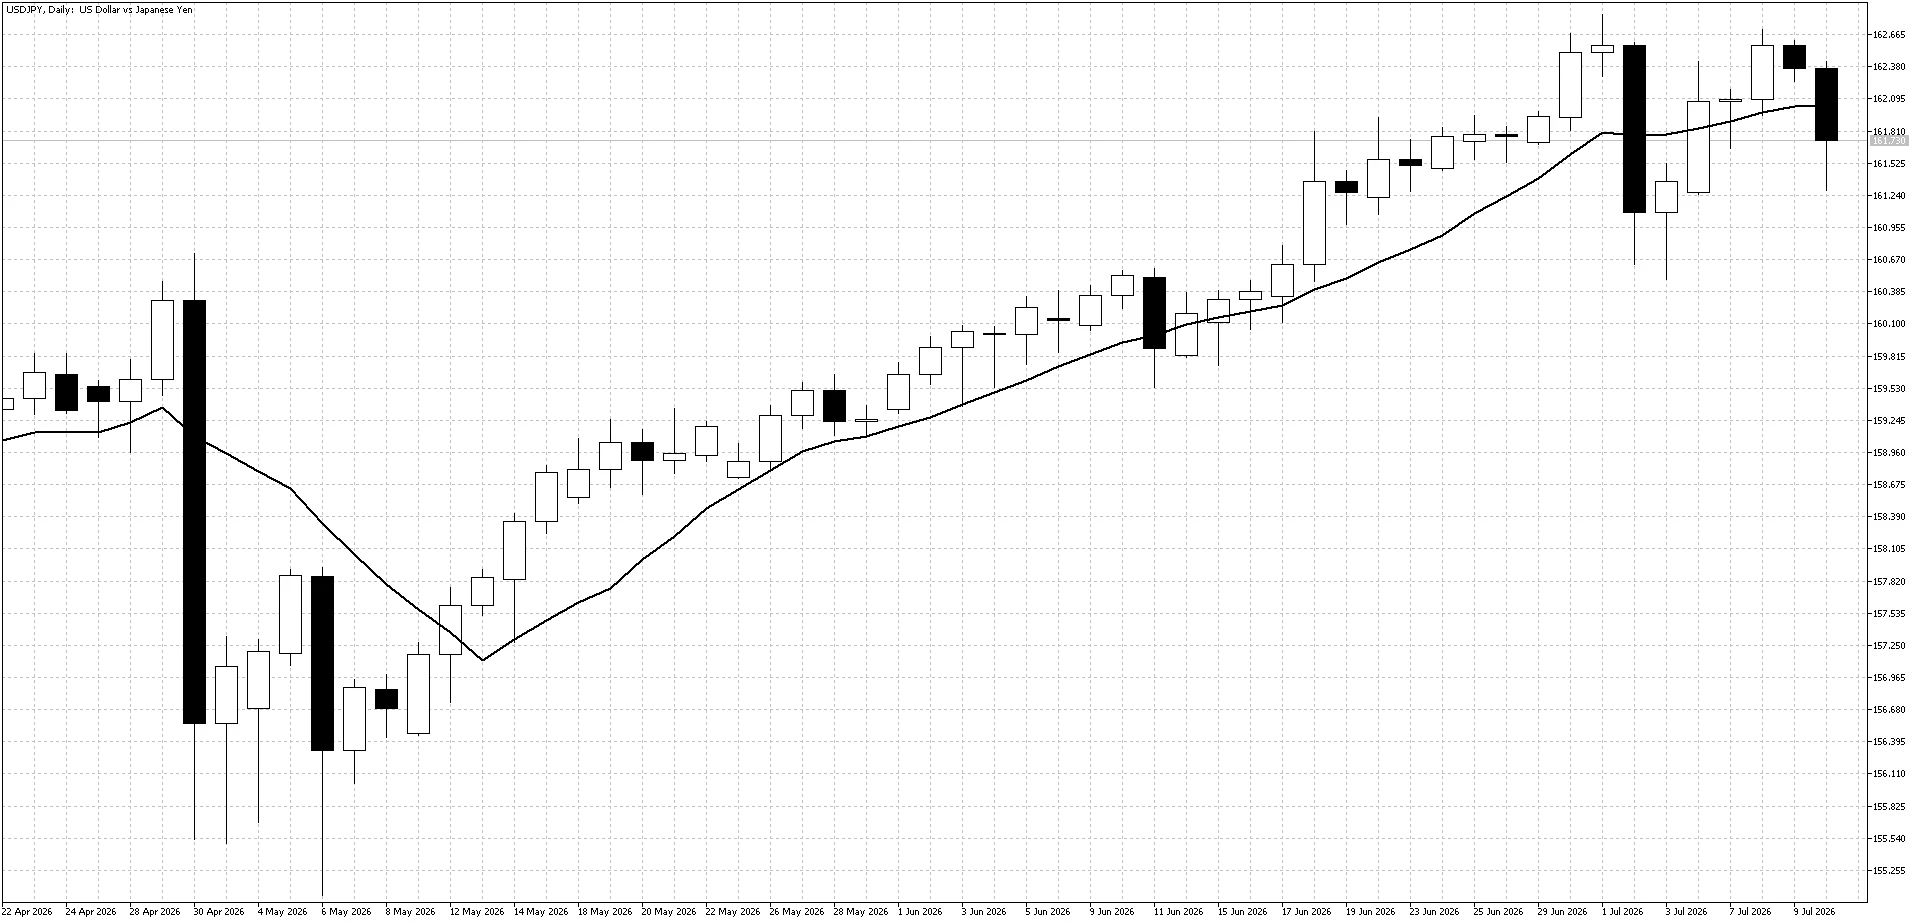
Current chart outlook
USD/JPY has met resistance near 163 twice over the past couple of weeks, while the Japanese government continues to look for ways to strengthen the yen.
The pair also closed the week below its 10-day moving average. This increases the chance of a double-top pattern forming if USD/JPY breaks below 160.50.
Key drivers
- Federal Reserve interest rate expectations
- Bank of Japan policy expectations
- U.S. inflation and employment data
- Japanese inflation and wage data
- U.S. Treasury yield direction
- Japan intervention risk
Trading ideas
Short-term traders may prefer to buy weakness and sell strength. The large interest rate difference between the U.S. and Japan may limit the downside, while the risk of Japanese intervention may limit further gains.
Medium-term traders may prefer to focus on selling strength. USD/JPY could retrace part of its strong rise over the past couple of months, especially if the Japanese government continues to encourage a stronger yen.
Trade Beyond Borders with Zero Spreads
Titan FX’s Trade Beyond Borders campaign gives traders the opportunity to trade selected popular FX pairs with Zero Spread* for three weeks only.
During Week 3, eligible pairs include EUR/USD, AUD/JPY, CAD/CHF, EUR/JPY and USD/JPY. EUR/USD remains included throughout the full campaign, while four additional FX pairs rotate each week.
The campaign period runs from 29 June 2026 to 19 July 2026, excluding 22:00–02:00 GMT+3 each day. No registration is required, and promotional trading conditions are applied automatically to eligible live Standard and Blade accounts.
Learn More: https://titanfx.com/promotions/zero-spreads
Zero spread conditions apply to Blade Accounts. Standard Accounts are subject to a fixed 1 pip spread. Commission charges apply to Blade Accounts.