Aayush Jindal
Key Highlights
- GBP/USD declined heavily below 1.1600 and 1.1500.
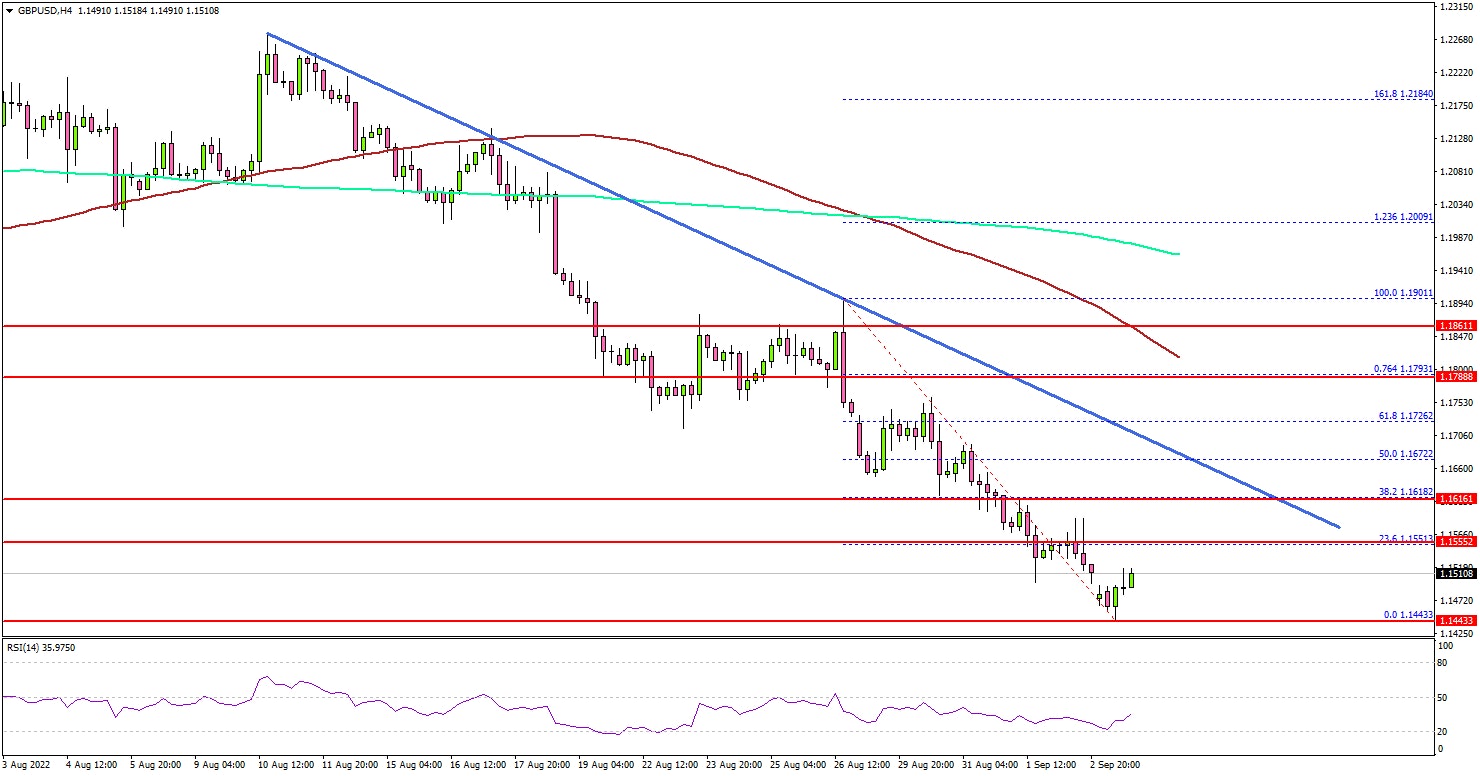
- A crucial bearish trend line is forming with resistance near 1.1625 on the 4-hours chart.
- EUR/USD is still struggling to stay above the 0.9900 support zone.
- The US ISM Services PMI could decline from 56.7 to 55.5 in August 2022.
GBP/USD Technical Analysis
The British Pound started a major decline from well above 1.1750 against the US Dollar. GBP/USD gained pace after there was a close below the 1.1650 level.

Looking at the 4-hours chart, the pair declined below the 1.1625 support, the 100 simple moving average (red, 4-hours), and the 200 simple moving average (green, 4-hours).
Finally, there was a move below the 1.1500 level and the pair traded as low as 1.1443. The pair is now consolidating losses above the recent low. On the upside, an initial resistance is seen near the 1.1550 zone.
The first major resistance is near the 1.1600 zone and the 1.1625 level. There is also a crucial bearish trend line forming with resistance near 1.1625 on the same chart.
A clear move above the 1.1625 level might start a steady recovery. In the stated case, GBP/USD may perhaps rise towards the 1.1750 resistance zone. If not, the pair might resume its decline below the 1.1460 level.
A downside break below the 1.1460 support might send the pair towards the 1.1380 support. The next major support is near the 1.1300 level. Any more losses might call for a move towards 1.1200.
Looking at EUR/USD, the pair remains in a bearish zone below the parity level and there could be a sharp decline below the 0.9900 level.
Economic Releases
- US S&P Services PMI for August 2022 – Forecast 44.1, versus 44.1 previous.
- US ISM Services Index for August 2022 – Forecast 55.5, versus 56.7 previous

