
Aayush Jindal
Key Highlights
- GBP/USD started a sharp downside correction from 1.3725.
- It traded below a major bullish trend line with support at 1.3600 on the 4-hour chart.
- EUR/USD remained supported near 1.1720 and recovered some losses.
- Bitcoin dipped below $115,000 and is now at risk of more losses.
GBP/USD Technical Analysis
The British Pound struggled above 1.3700 against the US Dollar. GBP/USD started a fresh decline below 1.3650 and 1.3600 after the recent Fed rate cut.
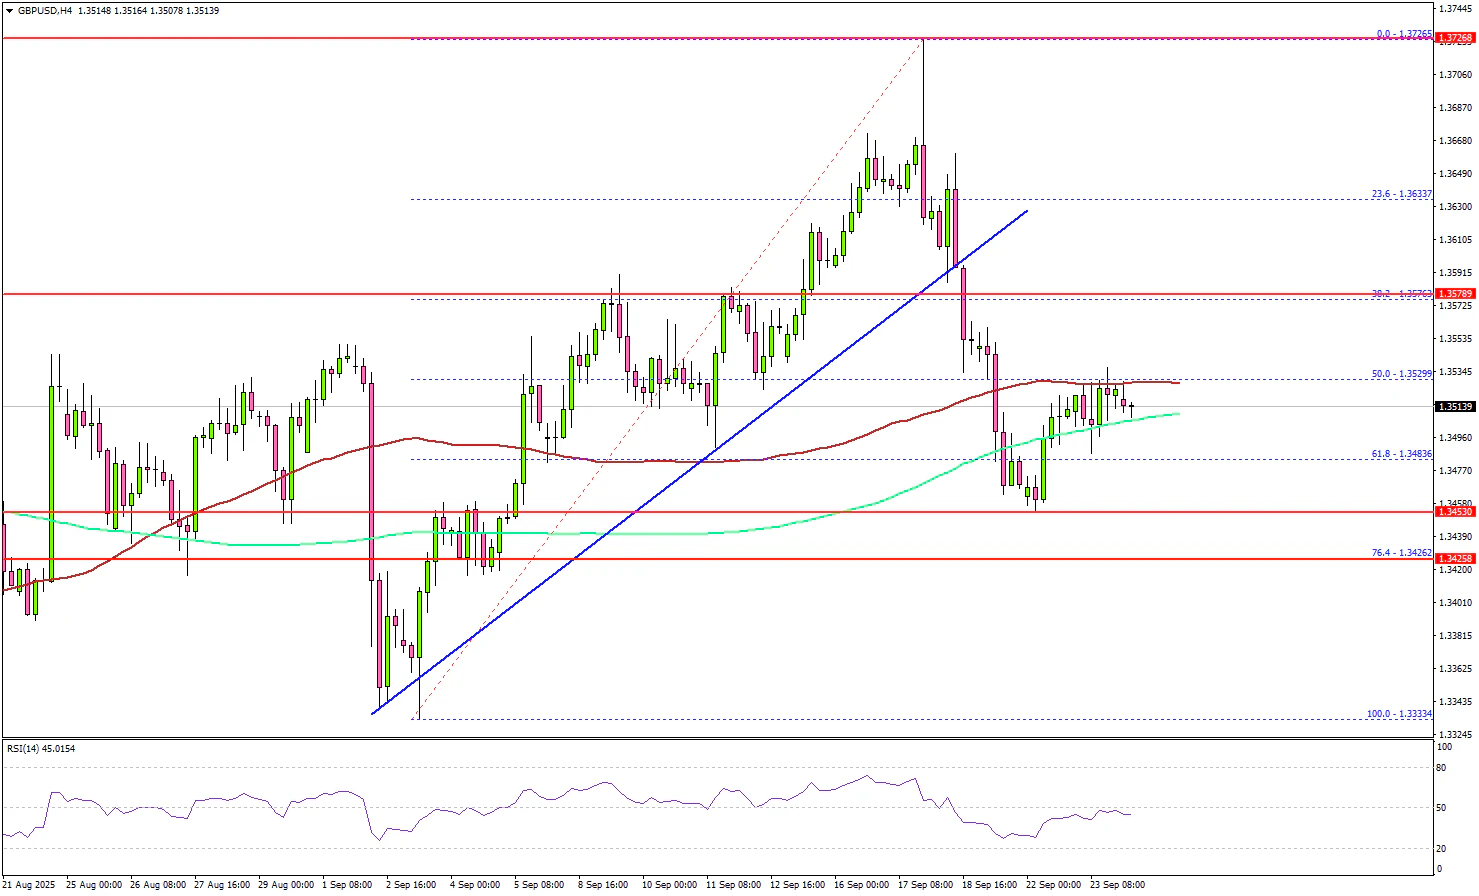
Looking at the 4-hour chart, the pair traded below a major bullish trend line with support at 1.3600 and then the 100 simple moving average (red, 4-hour). The bears pushed the pair below the 50% Fib retracement level of the upward move from the 1.3333 swing low to the 1.3726 high.
GBP/USD tested the 1.3460 support zone and recently corrected some losses. On the upside, the pair could face resistance near the 1.3550 level.
The first major hurdle for the bulls could be 1.3580. A close above 1.3580 could set the pace for a steady recovery wave. In the stated case, the pair could rise toward 1.3640, above which the bulls could aim for a move toward 1.3680. Any more upsides could send the pair toward 1.3725.
On the downside, there is a key support at 1.3450. The next area of interest might be 1.3420 and the 76.4% Fib retracement level of the upward move from the 1.1658 swing low to the 1.1918 high. The main support could be 1.3400. Any more losses might increase selling pressure and send GBP/USD toward 1.3255.
Looking at EUR/USD, the pair found support near the 1.1720 zone and recently corrected some losses and avoided more downside.
Upcoming Key Economic Events:
- US New Home Sales for Aug 2025 (MoM) – Forecast +0.1% versus -0.6% previous.
- BoE's Greene speech.
