Aayush Jindal
Key Highlights
- GBP/USD started a steady rise above the 1.2400 level.
- It surpassed a major bearish trend line with resistance near 1.2400 on the 4-hours chart.
- EUR/USD rallied above 1.1280 to move into a positive zone.
- The US ISM Non-Manufacturing Index increased sharply from 45.4 to 57.1 in June 2020.
GBP/USD Technical Analysis
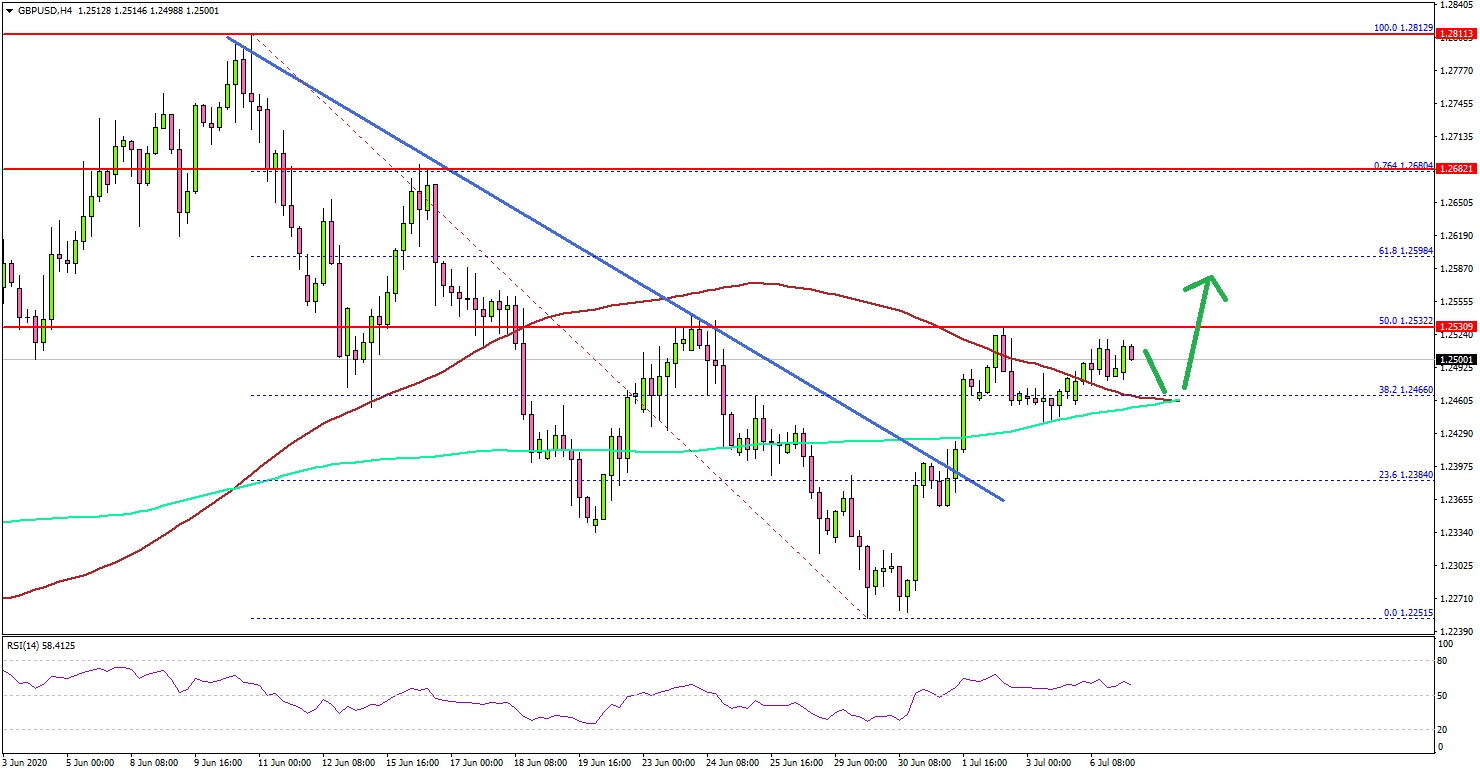
After trading as low as 1.2251, the British Pound started a fresh increase against the US Dollar. GBP/USD climbed above the 1.2350 and 1.2380 resistance levels to move into a positive zone.

Looking at the 4-hours chart, the pair broke a couple of important hurdles near 1.2400 and a connecting bearish trend line. The pair tested the 50% Fib retracement level of the key decline from the 1.2812 high to 1.2251 low.
Besides, there was a break above the 100 simple moving average (red, 4-hours) and the 200 simple moving average (green, 4-hours). It seems like the pair is trading with a positive bias and it could accelerate higher above the 1.2550 and 1.2580 levels.
The next key resistance is near the 1.2680 level. It is close to the 76.4% Fib retracement level of the key decline from the 1.2812 high to 1.2251 low.
If there is a downside correction, the 1.2440 level is an initial support zone. The main support is near the 1.2400 level (the recent breakout zone), below which the pair could revisit the 1.2300 zone.
Fundamentally, the US ISM Non-Manufacturing Index for June 2020 was released by the Institute for Supply Management (ISM). The market was looking for an increase from 45.4 to 50.1.
The result was above the forecast, as the US ISM Non-Manufacturing Index increased sharply from 45.4 to 57.1.
Overall, GBP/USD is currently consolidating and it could accelerate higher if it breaks the 1.2550 resistance in the near term.
Upcoming Economic Releases
- UK Halifax House Price Index for June 2020 (MoM) - Forecast -0.1%, versus -0.2% previous.
- UK Halifax House Price Index for June 2020 (3m/YoY) - Forecast +2.5%, versus +2.6% previous.

