
Aayush Jindal
Key Highlights
- GBP/USD started a steady increase and climbed above 1.3650.
- A bullish trend line is forming with support near 1.3580 on the 4-hour chart.
- Gold surged and broke the $4,620 resistance zone.
- Bitcoin remained elevated, and the bulls could aim for a close above $80,000.
GBP/USD Technical Analysis
The British Pound found support near 1.3450 against the US Dollar. GBP/USD started another increase above the 1.3580 resistance zone.
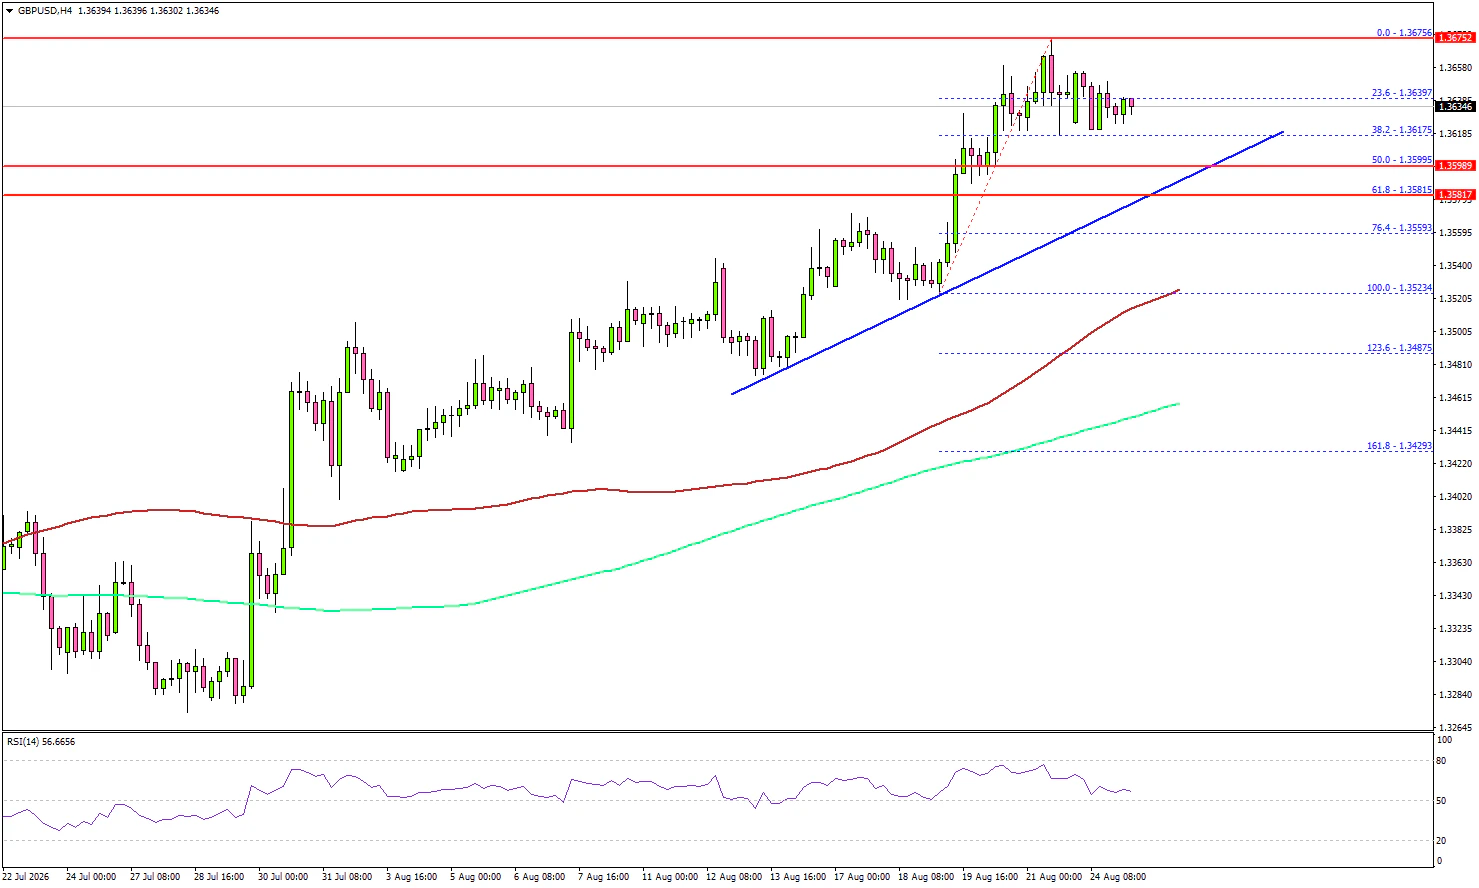
Looking at the 4-hour chart, the pair settled above 1.3600, the 100 simple moving average (red, 4-hour), and the 200 simple moving average (green, 4-hour). The pair climbed above 1.3650 and traded as high as 1.3675 on TitanFX before it started a consolidation phase.
On the downside, an immediate support could be near 1.3600 and the 50% Fib retracement level of the upward move from the 1.3524 swing low to the 1.3675 high.
The first major support could be near 1.3580. There is also a bullish trend line forming with support at 1.3580. The next major support could be near 1.3525 and the 100 simple moving average (red, 4-hour).
The main support might be 1.3450 and the 200 simple moving average (green, 4-hour). A downside break and close below 1.3450 might send the pair toward 1.3320. Any more losses could open the door for a test of 1.3250.
On the upside, the pair could face resistance near the 1.3675 level. The next major resistance might be 1.3720. A close above 1.3720 could start another steady increase. In the stated case, the bulls could aim for a move to 1.3800. Any further gains might open the door for a test of 1.3865.
Looking at Gold, the bulls seem to be back, and they might aim for a move above the $4,720 resistance level.
Upcoming Key Economic Events:
- US Housing Price Index for June 2026 (MoM) - Forecast +0.2%, versus +0.3% previous.
- S&P/Case-Shiller Home Price Indices for June 2026 (YoY) - Forecast +1.7%, versus +1.6% previous.
- Richmond Fed Manufacturing Index for August 2026 – Forecast 7.0, versus 5.0 previous.