
Nick Goold
Gold
Last week, gold experienced a notable uptick, registering strong gains primarily attributed to the lower-than-expected U.S. inflation data. This data fostered speculation among investors that the Federal Reserve might halt or slow down its pace of raising official U.S. interest rates. Such a shift in monetary policy traditionally benefits gold, reducing the opportunity cost of holding non-yielding bullion. The prospect of a less aggressive rate hike approach by the Federal Reserve played a critical role in bolstering gold's appeal, leading to its impressive performance.
Adding to gold's momentum was its move back above the 10-day moving average. This technical breakthrough occurred midweek and triggered additional buying interest from speculators. Many are now targeting a return to the $2,000 mark, a significant psychological level for the gold market. The combination of positive technical indicators and favourable fundamental conditions has set the stage for higher gold prices.
The situation in Gaza will require careful monitoring by traders, as any escalation or de-escalation will impact market sentiment. The week ahead might be more subdued due to the U.S. Thanksgiving holiday and a lighter economic data calendar. This environment suggests that range trading could be the most effective strategy for the week.
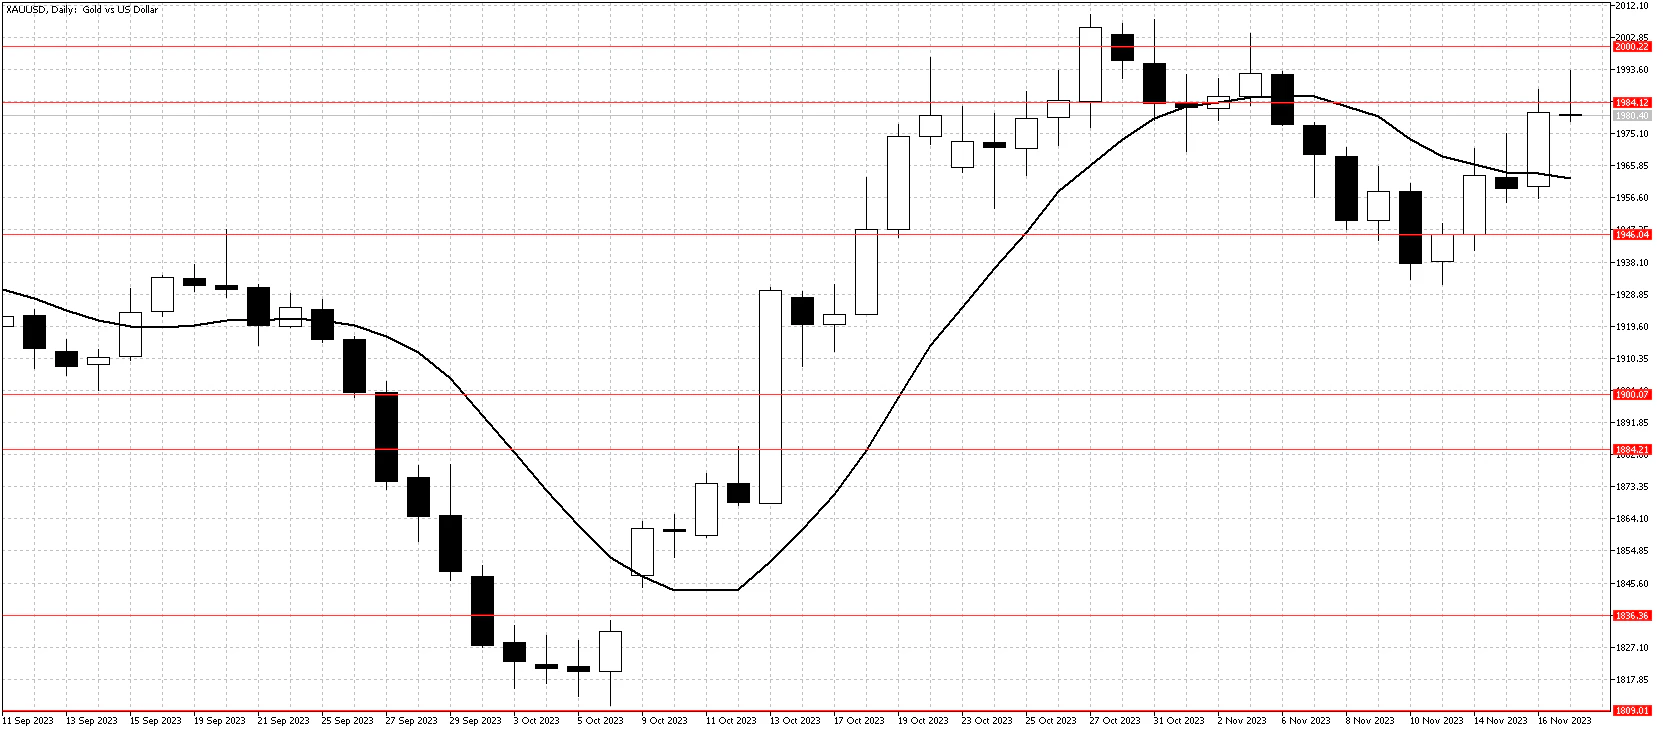
Resistance: 1984, 2000, 2050, 2070, 2080
Support: 1946, 1900, 1884, 1836, 1809
WTI
West Texas Intermediate (WTI) crude oil prices experienced a significant drop last week, reaching its lowest point in four months. This decline was primarily driven by growing concerns among traders about the global oil demand. These concerns were fueled by recent weak economic data emerging from the U.S. The apprehension about a potential slowdown in oil demand reflects broader market uncertainties about the global economic outlook, especially in the context of the U.S. economic indicators pointing towards a possible downturn.
The latest U.S. unemployment claims data contributed to the negative sentiment in the oil market, which showed an increase to a three-month high. This data suggests a possible easing of labour market conditions, potentially signalling a slowdown in economic activity. Additionally, U.S. data released on Wednesday indicated that oil inventories were more abundant than expected, further dampening market sentiment.
However, there are signs that the market might recover. Notably, WTI prices closed back above the critical $75 support level. This movement is seen as a positive indicator and could signal the beginning of a recovery in oil prices. Additionally, if WTI can move back above its 10-day moving average, it could present a short-term buying opportunity for traders this week.
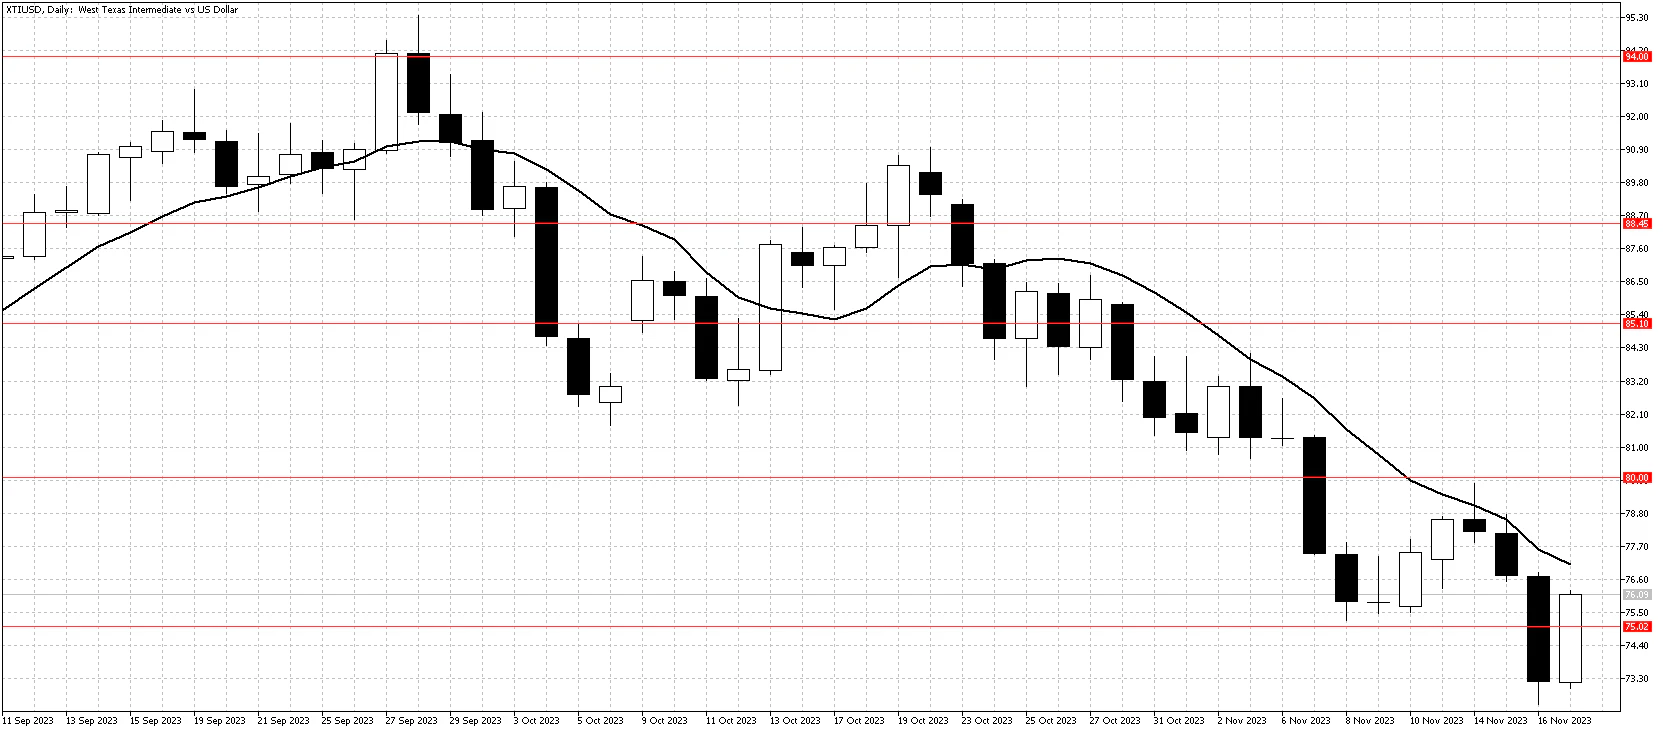
Resistance: 80.00, 85.10, 88.50, 94.00
Support: 75.00, 70.00
