
Aayush Jindal
Key Highlights
- Gold price is trading above the $1,850 and $1,860 support levels.
- A major bullish trend line is forming with support near $1,870 on the 4-hours chart of XAU/USD.
- EUR/USD climbed above 1.1850, and GBP/USD surpassed the 1.3200 resistance.
- The US Retail Sales increased 0.3% in Oct 2020 (MoM), down from +1.6%.
Gold Price Technical Analysis
After a sharp decline, gold price found support near $1,850 against the US Dollar. The price traded as low as $1,950.50 on TitanFX before it started a short-term upside correction.
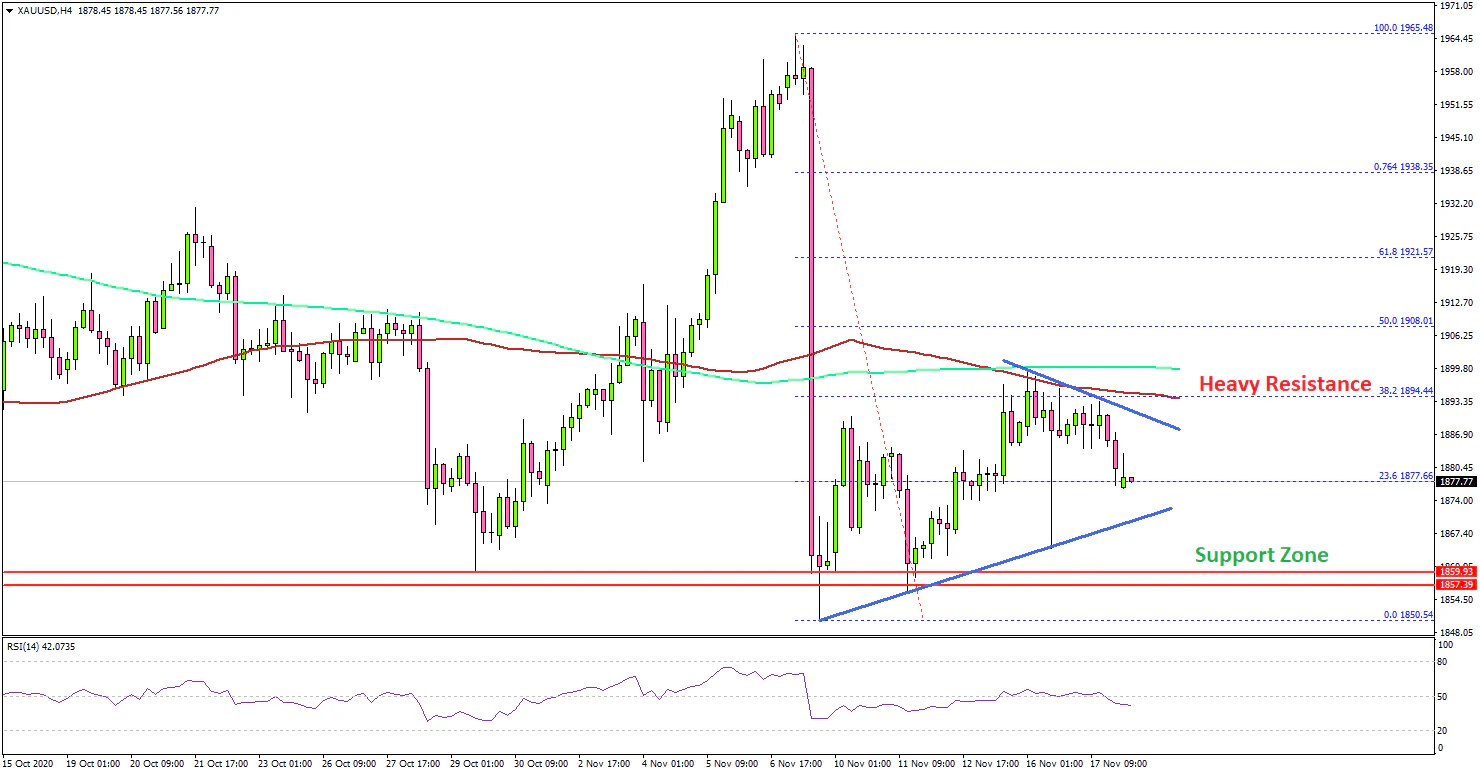
The 4-hours chart of XAU/USD indicates that the price recovered from the $1,850 support, but it struggled below the 200 simple moving average (green, 4-hours), and the 100 simple moving average (red, 4-hours).
The price also faced a strong resistance near the 38.2% Fib retracement level of the downward move from the $1,965 swing high to $1,850 low. It seems like the bulls are struggling to gain strength above the $1,900 resistance level.
The next major resistance is near the $1,910 level or the 50% Fib retracement level of the downward move from the $1,965 swing high to $1,850 low. A close above $1,910 could open the doors for a sharp increase towards the $1,925 and $1,930 resistance levels.
On the downside, there is a major bullish trend line forming with support near $1,870 on the same chart. A clear break below the trend line could push the price towards the main $1,850 support. Any further losses might lead the price to $1,820.
Overall, gold price is reaching a major breakout and it seems like it could either rally above $1,910 or dive towards the $1,850 support. Looking at EUR/USD, the pair started a fresh increase above the 1.1850 resistance. Similarly, GBP/USD gained bullish momentum above the 1.3200 and 1.3250 levels.
Economic Releases to Watch Today
- UK Consumer Price Index Oct 2020 (YoY) – Forecast +0.6%, versus +0.5% previous.
- UK Core Consumer Price Index Oct 2020 (YoY) – Forecast +1.3%, versus +1.3% previous.
- Euro Zone CPI Oct 2020 (YoY) - Forecast +0.2%, versus +0.2% previous.
- Euro Zone CPI Oct 2020 (MoM) - Forecast +0.1%, versus +0.1% previous.
- Canadian Consumer Price Index Oct 2020 (MoM) – Forecast +0.2%, versus -0.1% previous.
- Canadian Consumer Price Index Oct 2020 (YoY) – Forecast +0.4%, versus +0.5% previous.
