
Aayush Jindal
Key Highlights
- Gold price is struggling to recover above $1,815.
- A major bearish trend line is forming with resistance near $1,812 on the 4-hours chart.
- EUR/USD and GBP/USD declined heavily below 1.0365 and 1.2050 respectively.
- The US ISM Services PMI could decline from 55.9 to 54.5 in June 2022.
Gold Price Technical Analysis
Gold price attempted a recovery wave above the $1,810 level against the US Dollar. However, the price failed to continue higher above $1,815 and started a fresh decline.
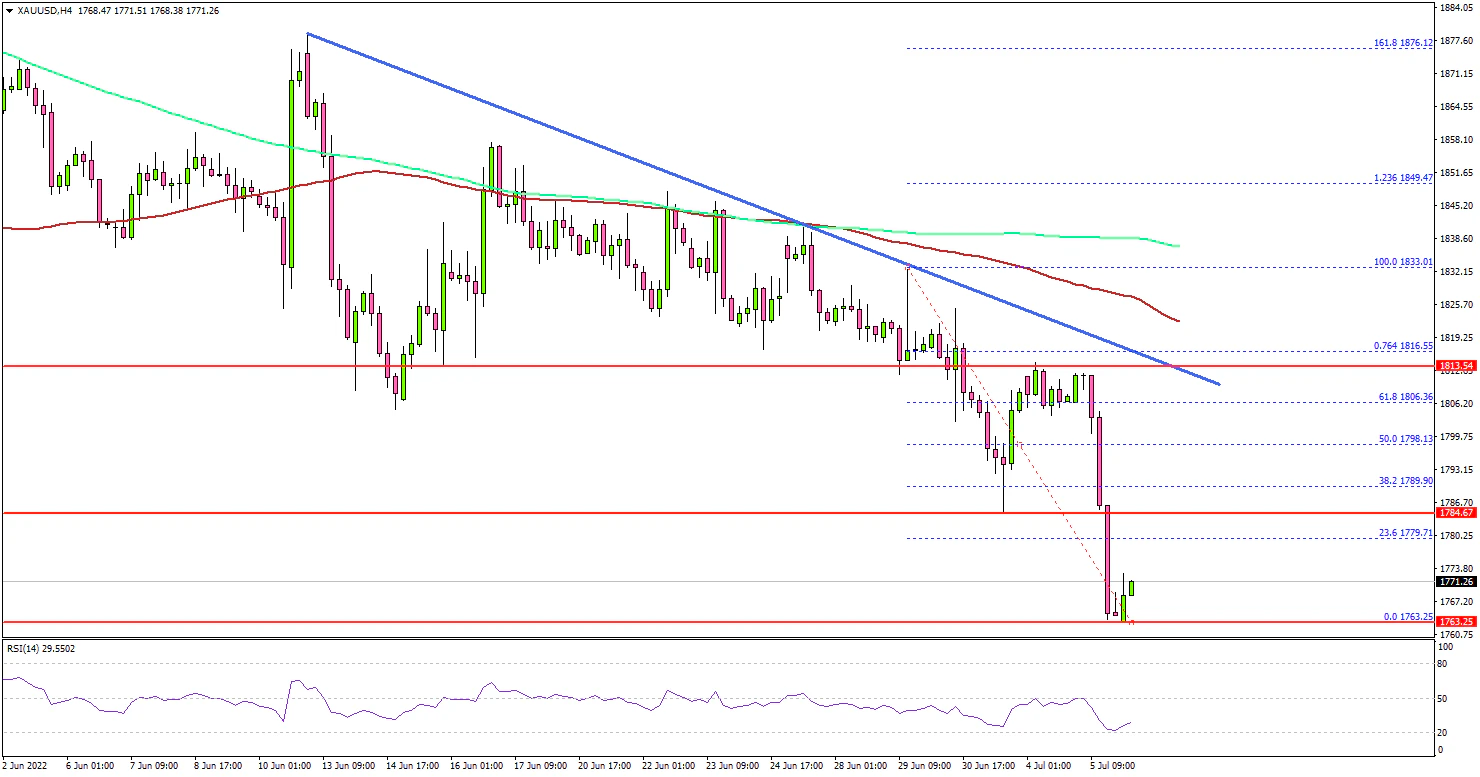
The 4-hours chart of XAU/USD indicates that the price is trading a bearish zone below $1,800, the 200 simple moving average (green, 4-hours), and the 100 simple moving average (red, 4-hours).
The recent rejection was near a major resistance at $1,815 (a multi-touch zone). There is also a major bearish trend line forming with resistance near $1,812 on the same chart.
The next major resistance is near the $1,825 level the 100 simple moving average (red, 4-hours). To start a decent recovery wave, the price must clear the trend line resistance and then settle above the $1,825 zone.
In the stated case, it could even test the $1,840 level and the 200 simple moving average (green, 4-hours). If there is no upside break, the price could continue to move down below $1,780.
The next major support is near the $1,760 level, below which the price could accelerate lower. In the stated case, the price may perhaps decline towards the $1,740 level.
Looking at EUR/USD, there was a sharp decline below the 1.0365 support zone. Similarly, GBP/USD dived below the 1.2050 and 1.2020 support levels.
Economic Releases to Watch Today
- US S&P Services PMI for June 2022 – Forecast 51.5, versus 51.6 previous.
- US ISM Services PMI for June 2022 – Forecast 54.5, versus 55.9 previous.
