Aayush Jindal
Key Highlights
- Gold price extended its rise and traded to a new multi-year high close to $1,790.
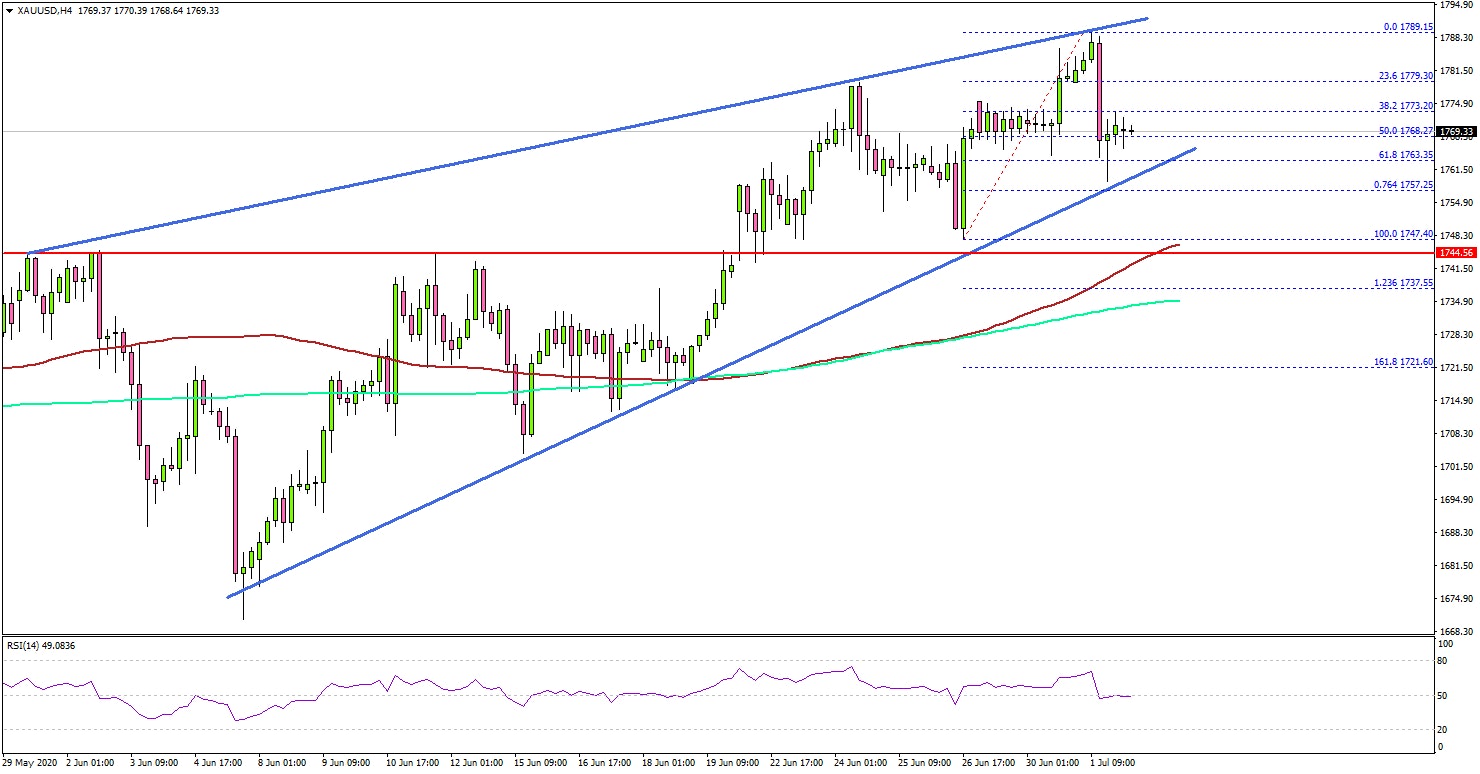
- A crucial bullish trend line is forming with support at $1,763 on the 4-hours chart of XAU/USD.
- The US ADP employment rose 2,369K in June 2020, less than the 3,000K forecast.
- The US nonfarm payrolls are likely to increase 3,000K in June 2020, more than the last 2,509K.
Gold Price Technical Analysis
In the past few weeks, gold price followed a bullish path and broke many hurdles against the US Dollar. The price remained well bid above $1,750 and recently climbed to a new multi-year high close to $1,790.

The 4-hours chart of XAU/USD indicates that the price settled above the $1,745 resistance zone, the 100 simple moving average (red, 4-hours), and the 200 simple moving average (green, 4-hours).
The bulls were able to clear the last swing high near $1,780 and the price traded as high as $1,789. Recently, there was a downside correction below the $1,780 level. The price tested the 61.8% Fib retracement level of the upward move from the $1,747 low to $1,789 high.
On the downside, there are many important supports, starting with $1,762. There is also a crucial bullish trend line forming with support at $1,763 on the same chart.
If the price breaks the trend line support, it could correct lower towards the $1,745 support and the 100 simple moving average (red, 4-hours). Any further losses may perhaps start a strong decline towards the $1,720 and $1,708 levels.
On the upside, an initial resistance is near the $1,780 level, above which the price might climb above the recent high at $1,789. In the mentioned case, the bulls could aim a test of the $1,800 level.
Fundamentally, the US ADP Employment Change for June 2020 was released by the Automatic Data Processing, Inc. The market was looking for a 3,000K rise, whereas the last was -2,760K.
The actual result was a bit lower than the forecast, as the private sector employment increased by 2,369K jobs from May to June 2020. More importantly, the last reading was revised from -2,760K to 3,065K.
Overall, gold price might continue to rise towards $1,800 as long as it is above $1,745. Looking at EUR/USD and GBP/USD, there are positive signs emerging and both pairs might start a decent upward move.
Economic Releases to Watch Today
- US nonfarm payrolls June 2020 – Forecast 3,000K, versus 2,509K previous.
- US Unemployment Rate June 2020 - Forecast 12.3%, versus 13.3% previous.

