
Nick Goold
Why is it called a bear market?
There are a few theories about the etymology of the term "bear market," similar to how the term "bull market" has an unclear origin.
One theory contends that the term "bear market" refers to how bears swipe their paws downward to attack their prey. This downward swipe is a representation of declining prices in a financial market.
Another theory suggests that the term may have come from the practice of "bearskin jobbers" in the 18th century. Bearskin jobbers were bearskin vendors who sold their wares ahead of time in the hopes that bearskins would become less expensive by the time they needed to buy them to fill their orders. It's possible that the phrase "bearing the market" was coined to describe market conditions in which prices were declining because of these sellers' behavior.
What is a bear market?
A bear market is a financial market where prices are generally falling. This could be a reference to any market, including those for stocks, bonds, commodities, or currencies. Low investor confidence and general pessimism about the market's future are characteristics of a bear market.
A bear market in forex trading is when the value of the base currency is declining in relation to the quote currency. For example, if the EUR/USD exchange rate is falling, the euro is getting weaker relative to the U.S. dollar. This decline may result from many things, including bad economic news, a decrease in the price of the base currency, or a rise in the supply of the quote currency.
Identifying a bear market
So how can someone trading forex spot a bear market? Here are a few crucial warning signs to watch out for:
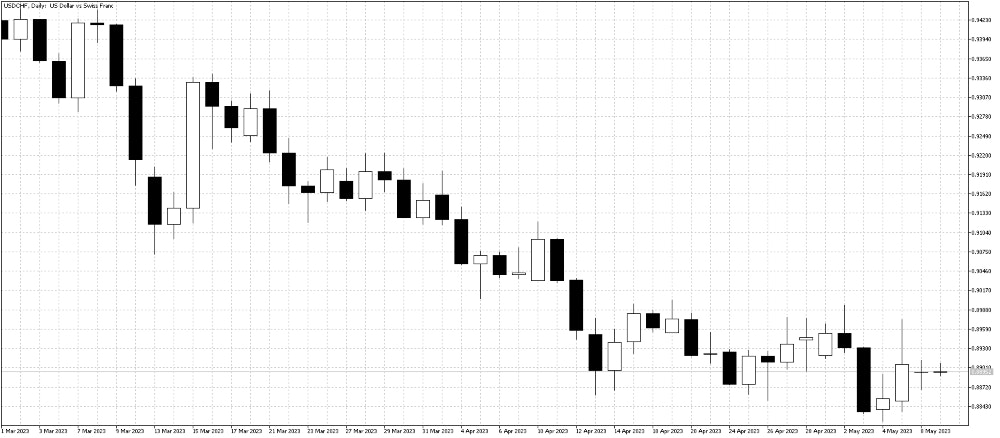
A downtrend in price
The most obvious sign of a bear market is a downtrend in price. This indicates a downward trend in the exchange rate over time. You can use technical analysis tools such as moving averages, trendlines, or the Relative Strength Index (RSI) to identify a downtrend.
Moving averages help determine the market's trend as they smooth out the fluctuations in the price data. One way to use moving averages to determine if current market conditions are bearish is by comparing the current price of an asset to its moving average. For example, the market may be downtrend, and the bears may be in control if the current price is below the moving average.
When the current price of a stock is lower than its 50-day moving average, for instance, it indicates that the market is bearish. This is because the moving average shows the average stock price over the previous 50 days, and if the current price is lower than that average, it indicates that the most recent trend has been downward.
Additionally, the moving average's direction can indicate whether the market is bearish or bullish. For example, the market is bearish if the moving average slopes downwards and bullish if the moving average slopes upwards.
A trendline is a straight line that connects two or more price points and is used to identify a trend. For example, in a bear market, the trendline usually slopes downward as the asset price decreases over time.
To determine the existence of a bear market using trendlines, traders can draw a line that connects the highs of the price action. When this line slopes downward, it indicates a bearish trend in the market. Traders can also make a line connecting the low points of the price action. The existence of a bear market is further supported if this line is also sloping downward.
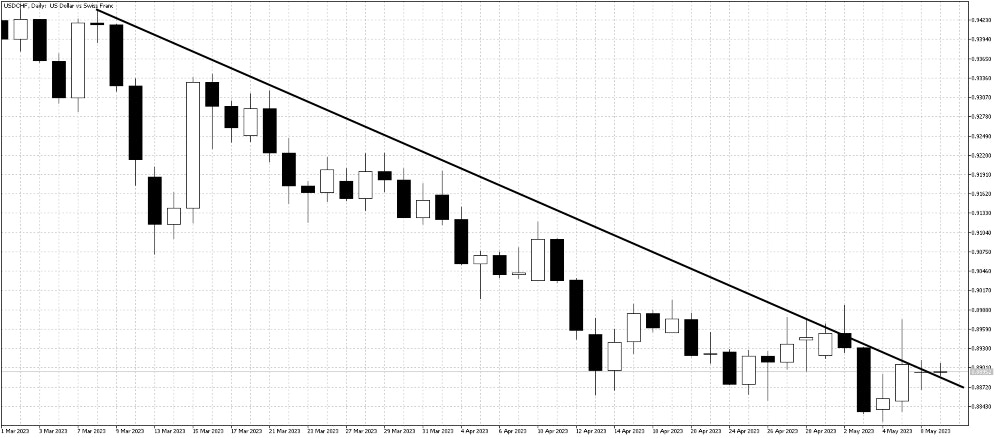
Trendlines can be used to trade in a bear market by looking for opportunities to sell an asset as its price approaches the trendline. This is known as a "resistance" level, as the trendline acts as a barrier to further upward movement in the price. Conversely, if the price breaks through the trendline, it may indicate a reversal of the bearish trend, and traders may look for buying opportunities.
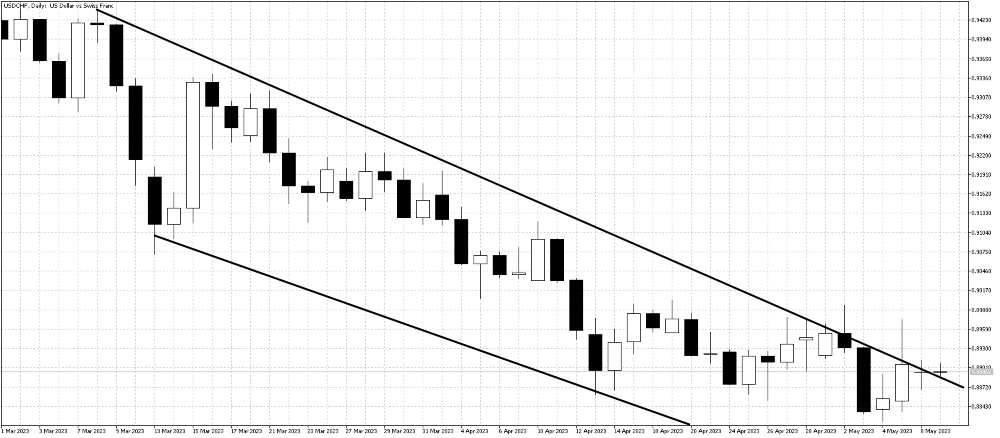
Another way to use trendlines to trade during a bear market is to look for "support" levels. These are the areas where the price has previously encountered resistance and changed course. When the price of an asset is approaching a trendline that they have drawn connecting the lows of the price action, traders can look for opportunities to buy the asset. Conversely, if the price crosses the trendline, it might be a sign that the bearish trend will continue, and traders might start looking for selling opportunities.
The Relative Strength Index (RSI) is a popular technical analysis indicator that measures the strength of an asset's price action. It can be used to determine if the market conditions are bearish and to find potential trading opportunities.
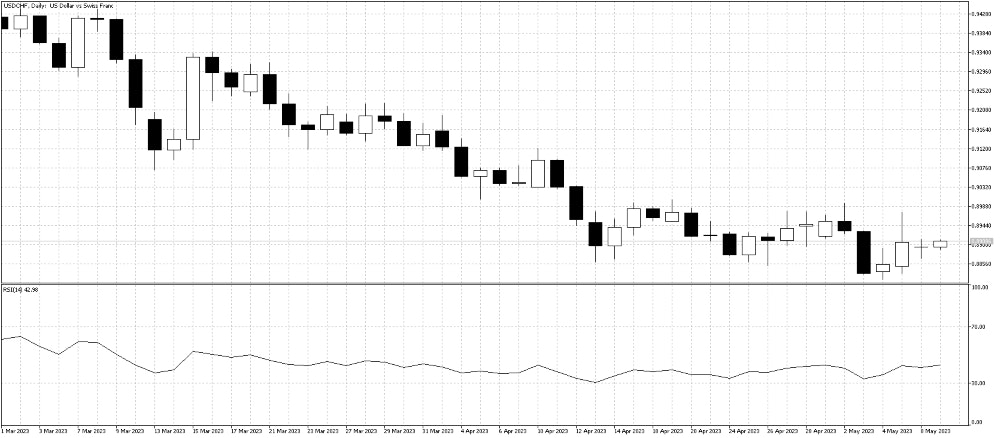
The RSI is calculated based on an asset's average gain and loss over a specified period, usually 14 days. The indicator ranges from 0 to 100; readings above 70 denote overbought conditions, while readings below 30 denote oversold conditions.
In a bear market, the RSI can be used to confirm the presence of a downtrend. The RSI typically displays lower and lower highs, reflecting the market's downward trend. As a result, the asset may be oversold, and the bears may be in control if the RSI falls below the 30 level.
Negative economic indicators
You can also get hints about the market's direction from economic indicators. For example, negative economic indicators like high unemployment, slow GDP growth, and declining consumer confidence are common in bear markets. So watch news releases and economic calendars for the most recent information.
Decreased trading volume
Trading volume typically declines in a bear market as fewer traders are willing to enter the market. Using trading platforms or charting tools, you can monitor trading volume.
Bearish sentiment
Finally, a general feeling of pessimism and bearish sentiment among traders is frequently present during a bear market. You might notice more chatter on social media, negative news headlines, or a general feeling of unease among market participants.
In a bear market, prices decline, and investor confidence is low. A bear market in forex trading is when the value of the base currency is falling in relation to the quote currency. Forex traders must be able to spot bear markets and comprehend what causes them. Making informed trading decisions and seizing market opportunities requires monitoring price trends, economic indicators, trading volume, and general sentiment.