Nick Goold
Support and resistance analysis is one of the most important skills for traders to master. Whether you trade forex, stocks, indices, or commodities, identifying these key price levels can help you understand market conditions and improve your entries and exits. While there are many technical indicators available, every trader should learn how to read and apply support and resistance effectively.
Before opening a trade, analyzing support and resistance levels provides a clearer picture of where prices may pause, reverse, or break out. Knowing these levels in advance helps you find stronger entry points, manage risk, and plan profit targets more effectively.
What is support and resistance?
Support is a price level where the market tends to find buying interest. When the price falls to this level, it is more likely to bounce higher as buyers step in.
Resistance is a price level where the market tends to find selling interest. When the price rises to this level, it is more likely to fall back as sellers take profits or open new short positions.
Many beginners overcomplicate trading, thinking complex methods will improve performance. In reality, overly complicated approaches often lead to indecision and unnecessary losses. The key is to identify reliable support and resistance levels using proven methods. Below are the five most common ways traders calculate support and resistance.
Support Method 1: Previous Lows
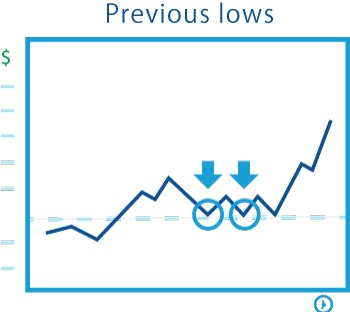
One of the most widely used methods is looking at recent lows. If the market has bounced from a certain price level multiple times, that low becomes a strong support zone. The more times a level is tested, the more significant it becomes in the eyes of traders.
Support Method 2: Past Resistance
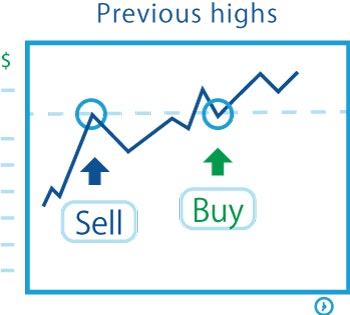
Old resistance levels can turn into new support. When the market breaks above resistance, traders who were previously short may exit to avoid further losses, creating buying pressure at that level. This phenomenon causes resistance to flip into support.
Support Method 3: Moving Averages
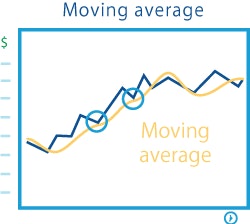
Moving averages are one of the most popular indicators used by traders. In an uptrend, a rising moving average often acts as dynamic support, with price bouncing higher each time it touches the average.
Support Method 4: Trendlines
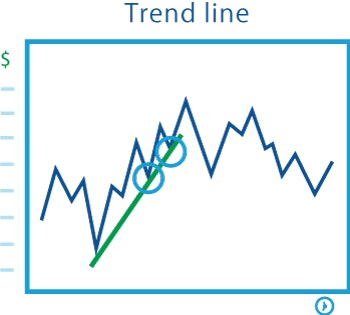
Drawing a line connecting higher lows in an uptrend creates a trendline. This line often acts as support, guiding the upward direction of the market. As long as the trendline holds, traders consider the trend intact.
Support Method 5: Round Numbers
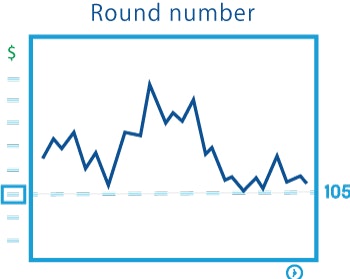
Psychological round numbers (such as 145.00 for USD/JPY, 35,000 for the Dow Jones Index, 1500 for gold, or 1.2000 for GBP/USD) often act as support because traders naturally place buy orders around these levels. These figures are easy to remember and attract significant market attention.
Resistance Method 1: Previous Highs
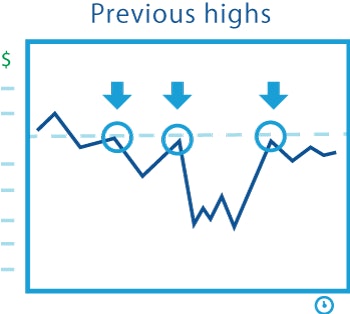
Just as previous lows create support, previous highs create resistance. If the market has fallen from a certain level before, traders will watch that level again as a potential selling opportunity.
Resistance Method 2: Previous Support
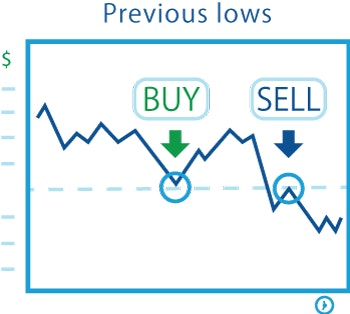
When support breaks, it often becomes new resistance. Traders who bought near support but took losses may look to sell when the market retests that level, creating selling pressure and turning support into resistance.
Resistance Method 3: Moving Averages
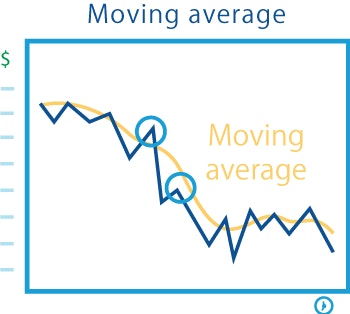
In a downtrend, moving averages slope downward and act as dynamic resistance. Each time price rallies toward the moving average, it often stalls or reverses lower.
Resistance Method 4: Trendlines
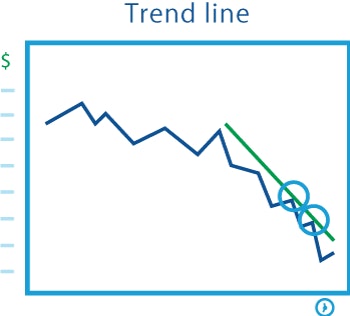
Connecting a series of lower highs in a downtrend creates a downward-sloping trendline. This line often acts as resistance, capping rallies and keeping the market in a bearish direction.
Resistance Method 5: Round Numbers
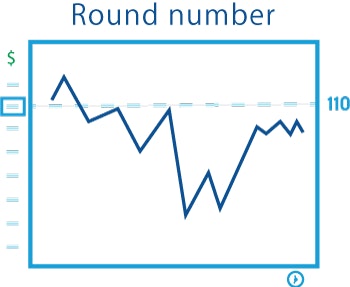
Round numbers work both ways—they can serve as support or resistance. For example, gold may struggle to break above $2000, or USD/JPY may find resistance at 150.00, simply because these levels attract large orders from traders and institutions.
Final Thoughts
Support and resistance levels are not exact prices where markets always reverse. Instead, they are zones where supply and demand are concentrated. By combining multiple methods—such as previous highs/lows, moving averages, trendlines, and round numbers—traders can increase their chances of identifying the most reliable zones. Building a trading strategy around these levels helps improve entries, exits, and overall risk management.

