
Nick Goold
The double bottom is a popular and profitable trading pattern for short-term and long-term traders.
A double bottom is a bullish chart pattern that forms when the same low is touched twice, and the price rises above the high made between the two lows. The appearance of a double bottom is a contrarian trading strategy with the power to generate a significant rise in prices.
Let's look at an example of a double bottom formed on the 5-minute and daily charts.
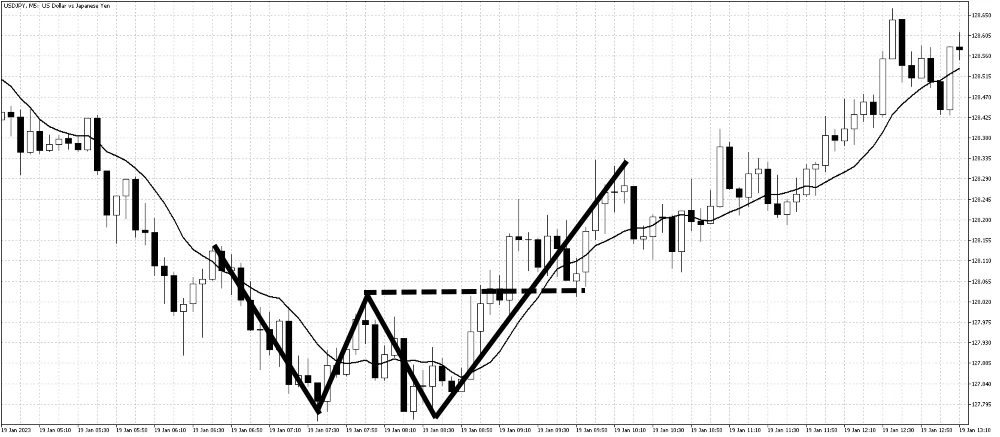
5-minute chart double bottom pattern
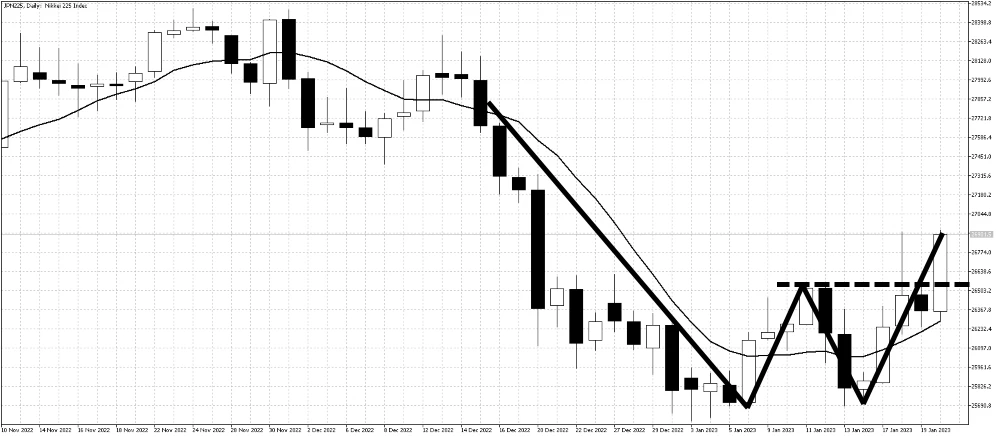
Daily chart double bottom pattern
Tips for trading a double-bottom pattern.
1. Watch the news
Regardless of the chart pattern, following news is a crucial part of trading. If the downtrend is strong, check the news to see why, and if the news is bearish, do not trade the double-bottom pattern. Bearish news increases prices' likelihood of falling further without forming a double bottom.
2. Choose markets with high volatility
Double-bottom buy signals are more likely to be profitable when traded in highly volatile markets. However, be sure to set a stop-loss order when doing so!
There is no need to fear volatile markets. You can prevent a significant loss if you set a stop. When trading in a volatile market, select a target price at least twice as high as your stop-loss price from the current level.
3. Chart patterns are more powerful in the longer term
Double bottoms on the daily or weekly chart are more powerful than those on the one-minute or five-minute chart. It is, therefore, important for short-term traders to check long-term charts, such as daily or weekly, to see if a chart pattern is about to form or has already formed. Always check the long-term chart well before starting a trade.
For example, if a double bottom has formed on the five-minute chart, but the daily chart is bearish, it is better not to take a buy trade.