Nick Goold
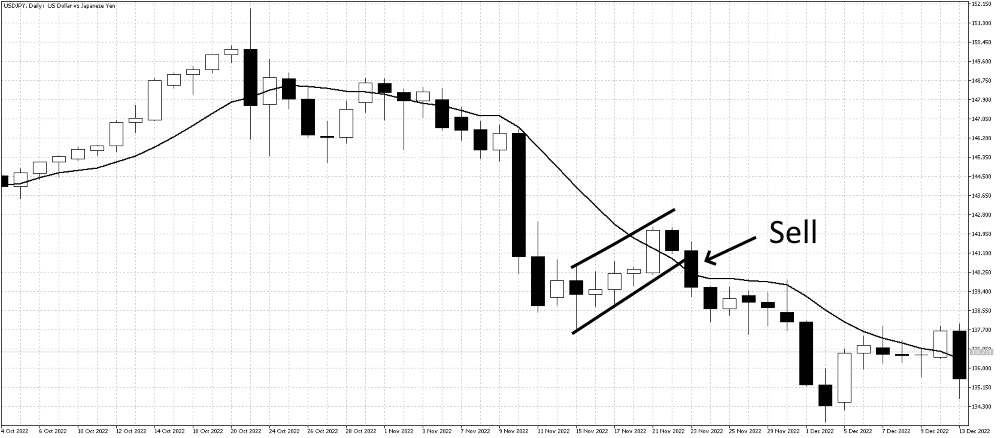
The bearish flag pattern is a technical analysis pattern that typically forms during a downtrend in the price of a financial market. This pattern is called a "flag" because it looks like a flagpole with a flag upside down.
The pattern begins with a strong downward move in price, followed by a brief period of consolidation where the price moves sideways in a narrow range. This consolidation period usually takes the form of a small upward retracement in price, forming a small "flag" shape. After the consolidation period, the price typically continues its downward trend.
How to trade the bearish flag pattern

To trade the bearish flag pattern, traders typically wait for the consolidation period to end and for the price to break below the lower support level of the flag pattern. Falling below the bottom of the flag signals a continuation of the downtrend. Traders can place a sell order just below the lower support level of the flag pattern.
It is important to note that not all bearish flag patterns will result in a successful breakdown, and false breakouts can occur. Therefore, confirming the breakout with other technical indicators and checking the market's news can be helpful before entering a trade. If the market is quiet and there is little news, then the bearish flag's profitability can be lower.
The bearish flag pattern is tradable on any chart length (1 minute to monthly), but it is usually more profitable on longer-term charts like daily or longer. It is more profitable on the daily chart because there is a higher likelihood that other traders will also see the same pattern and sell should prices fall below the bottom of the flag.
Bearish flag pattern risk management
The bearish flag pattern is a trend-following strategy, so setting your initial target at least double your stop loss is vital.
Stop loss
There are two methods to place a stop loss when trading the bearish flag pattern.
Method 1
Place your stop loss level above the top of the flag resistance level. This stop-loss level can be quite large and best for day traders and swing traders.
Method 2
For short-term traders who use a scalping strategy, placing a stop just above the previous low can be a better approach as they can use a smaller stop loss and profit target.
Profit target
Calculating a profit target using the flag pole size can be helpful. For instance, if the market fell 80 pips (125.90 to 125.10) from the start of the downtrend to the flag, if you sold at 125.10, you would set a target at 124.30.
Bearish flag pattern psychology
The bearish flag pattern requires subjective analysis instead of other technical analysis methods like an objective moving average. Using a subjective technical analysis pattern can be stressful as traders can question their analysis after making losses. While each trader can have different ways of viewing technical patterns, traders need to remember no pattern will make profits 100% of the time. Instead of trying to find the perfect technical pattern, focus on maximizing your profits and minimizing your losses; your stress levels should decrease.

