
Nick Goold
Gold
Following the FED minutes last week, increased fears of a recession helped Gold record a new high for 2023. The weaker USD helped Gold get closer to the all-time high of $2,075. However, Fed Waller's comments Friday that inflation is still not under control and higher interest rates would be required turned Gold sentiments bearish, seeing prices test back below $2000 quickly.
This week there is little news that will likely impact Gold prices, so the market will closely watch movements in the USD and US stock markets. While many bulls remain in Gold, the reduced risk in the banking sector and potential for further US interest rate increases is bearish for Gold.
Monday's price action will be significant as the 10-day moving average is close to current prices. Many technical traders are looking for higher, so they are likely to view the 10-day moving average as support, but should prices fall below $2,000 again, the potential of another large fall is high. This week's most likely scenario is sideways price action due to a lack of news and bullish traders remaining confident in the long-term future of Gold.

Resistance: 2032, 2050, 2070
Support: 2000, 1985, 1950, 1935, 1918, 1900
WTI
WTI continued to draw strength from the recent OPEC production cuts, pushing above resistance at $82.50 last week. At the same time, increased risks of a US recession and higher interest rates to control inflation saw WTI close the week below the $82.50 resistance.
Prices failing to rise significantly above $82.50 is a bearish sign for the week ahead, so there is an increased chance of lower prices this week. However, the upward trend is strong, so expect support around the 10-day moving average and $80. Range trading looks to be the best strategy for short-term traders and potentially a selling opportunity for medium-term traders.
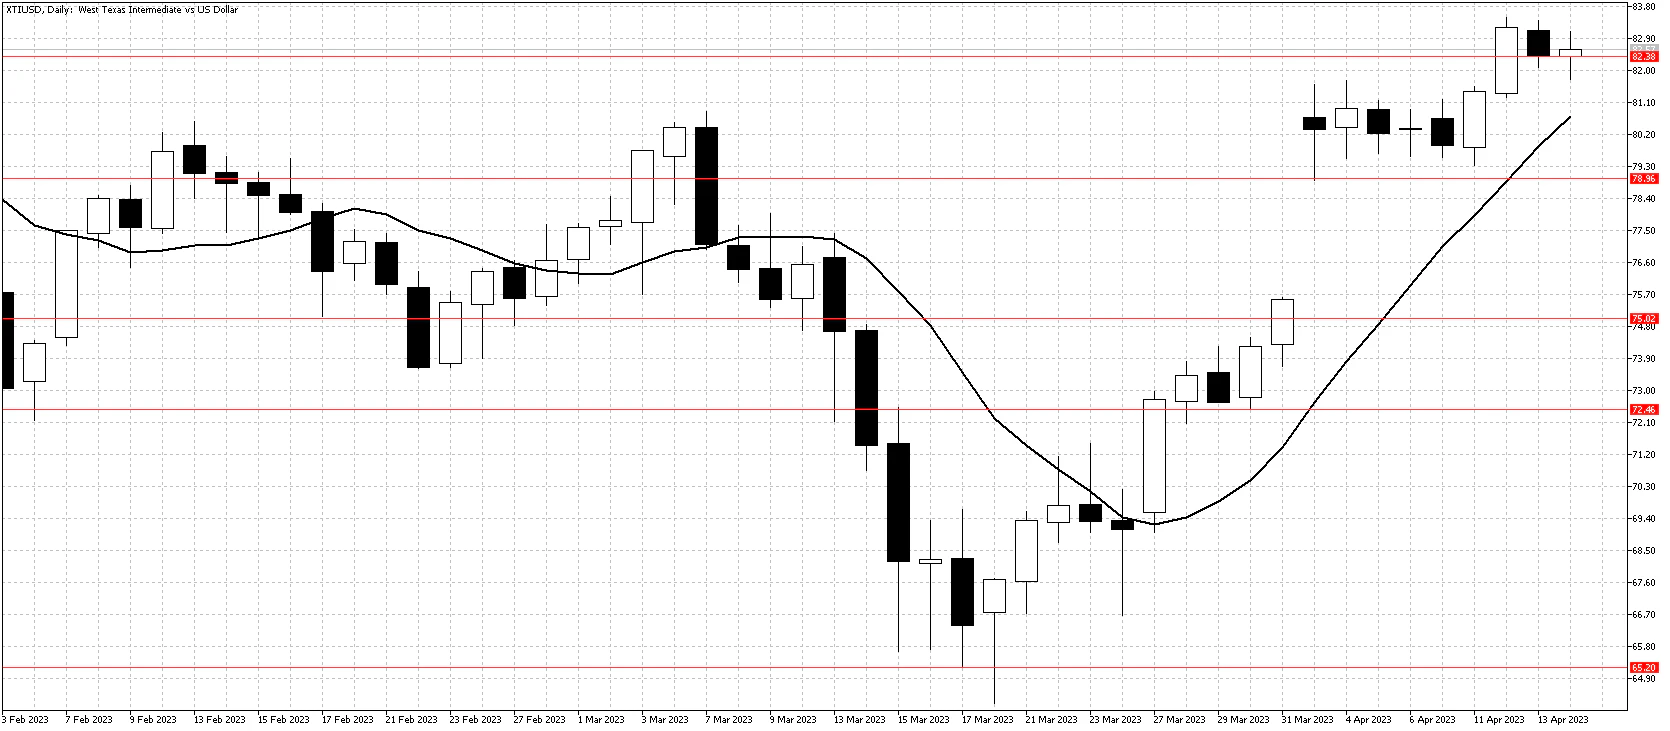
Resistance: 82.50, 85.00, 90.00
Support: 79.00, 75.00, 72.50, 70.00, 65.00, 62.00
