
Aayush Jindal
Key Highlights
- Microsoft’s stock price climbed to a new all-time high at $415.09 on TitanFX.
- A key bullish trend line is forming with support at $395 on the daily chart.
- Microsoft reported a strong increase of 18% in revenue for the quarter ended December 31, 2023.
- The price is consolidating gains and there could be more upsides above $415.
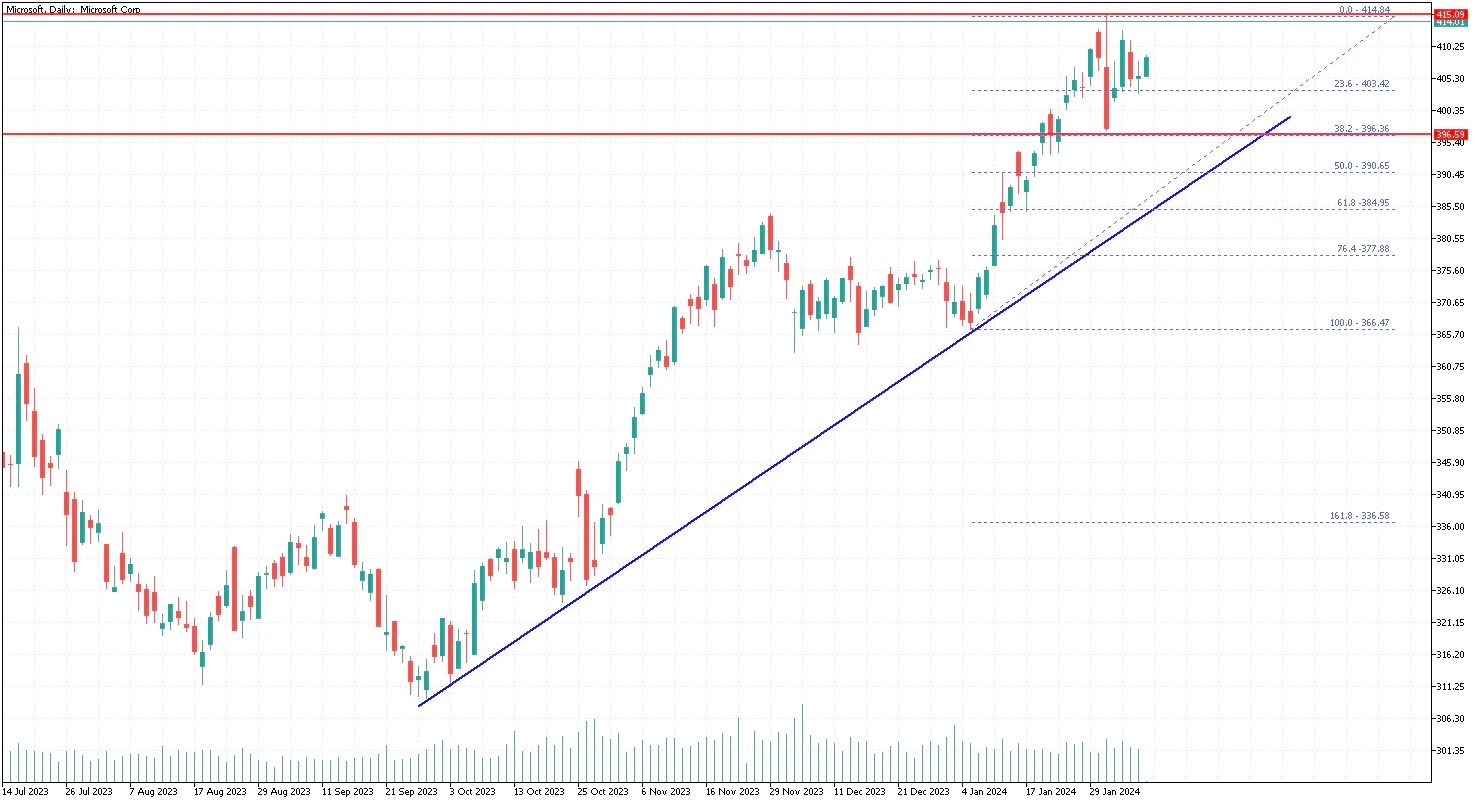
Microsoft Stock Price Analysis
In the last analysis, we saw a strong increase in Microsoft’s stock price (NASDAQ: MSFT) above the $300 level. The bulls remained active, and the uptrend extended above $400.
On January 30, 2024, Microsoft Corp. today announced its earnings report for the quarter ended December 31, 2023. Revenue was $62.0 billion and increased 18%, operating income was $27.0 billion and increased 33%, and net income was $21.9 billion and increased 33%.
Looking at the daily chart, the price gained bullish momentum above the $350 resistance. It even broke the $400 handle and traded to a new all-time high at $415.09 on TitanFX. The price is now consolidating gains below the $415 level.
There is also a key bullish trend line forming with support at $395 on the daily chart. The trend line is close to the 38.2% Fib retracement level of the upward move from the $366.47 swing low to the $415.09 high.
If there is a downside break below the trend line, the price could reach the $390 level. It is close to the 50% Fib retracement level of the upward move from the $366.47 swing low to the $415.09 high.
The main support sits at $378, below which Microsoft stock price could revisit the $365 support. On the upside, the $415 level presents resistance. A close above $415 might open the doors for a move toward the $440 level in the coming days.
Economic Releases
- US Initial Jobless Claims - Forecast 220K, versus 224K previous.
